Figure 3.

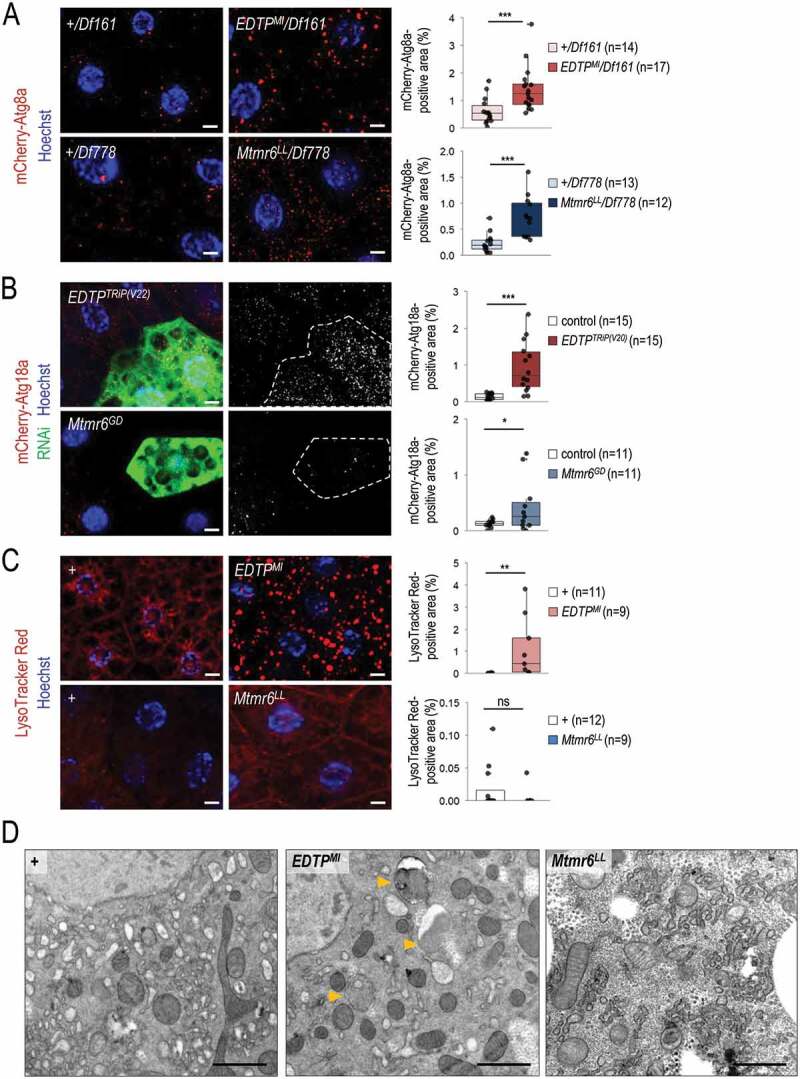
Under nutrient-rich conditions, EDTP suppression leads to increased amounts of early and late autophagic structures whereas Mtmr6 inactivation causes the accumulation of early autophagic structures only. (A) Deficiencies that overlap the genomic region of EDTP or Mtmr6 were used to generate transheterozygous (or hemizygous) animals. Mutational inactivation of EDTP (EDTPMI/Df161) and Mtmr6 (Mtmr6LL/Df778) in hemizygous backgrounds increases the amounts of mCherry-Atg8a-positive structures (red foci; forming phagophores, autophagosomes, and autolysosomes). (B) Clonal silencing of EDTP and Mtmr6 elevates the quantity of mCherry-Atg18a-positive early autophagic structures. Clonal cells (green) treated with RNAi are outlined by a white dotted line. Analysis was performed by using hsFLP; UAS-Dcr-2; r4-mCherry-Atg18a, Act<CD2< Gal4, UAS-nlsGFP animals. (C) EDTP deficiency enhances the amount of acidic compartments, primarily autolysosomes, labeled by LysoTracker Red (LTR, red dots), as compared to control. Inhibiting Mtmr6 does not elevate the amount of LTR-positive structures. (D) Ultrastructural analysis of autophagy in fat body cells under well-fed conditions. In control (w1118) larvae maintained under nutrient-rich condition, autophagic structures cannot essentially be observed by transmission electron microscopy (TEM). In well-fed EDTPMI mutant larvae elevated numbers of autophagic structures are observed by TEM. In the homozygous Mtmr6LL mutant genetic background more extensive internal membrane formation can be detected. Arrowheads indicate autophagic structures. Scale bars: 1 µm. In panels A-C, Hoechst staining (blue) indicates nuclei, scale bars: 10 μm. Fluorescence microscopy images were composed of multiple optical sections. Quantifications are shown in box plots, *: p < 0.05, **: p < 0.01 ***: p < 0.001, ns: not significant. For statistics, see the Materials and Methods section. In panel A, +/Df161 and +/Df778 were used as controls. In panel C and D, w1118 was used as a control (indicated as “+”). Fat bodies were prepared from well-fed animals at the third instar feeding larval (L3F) stage
