Figure 6.

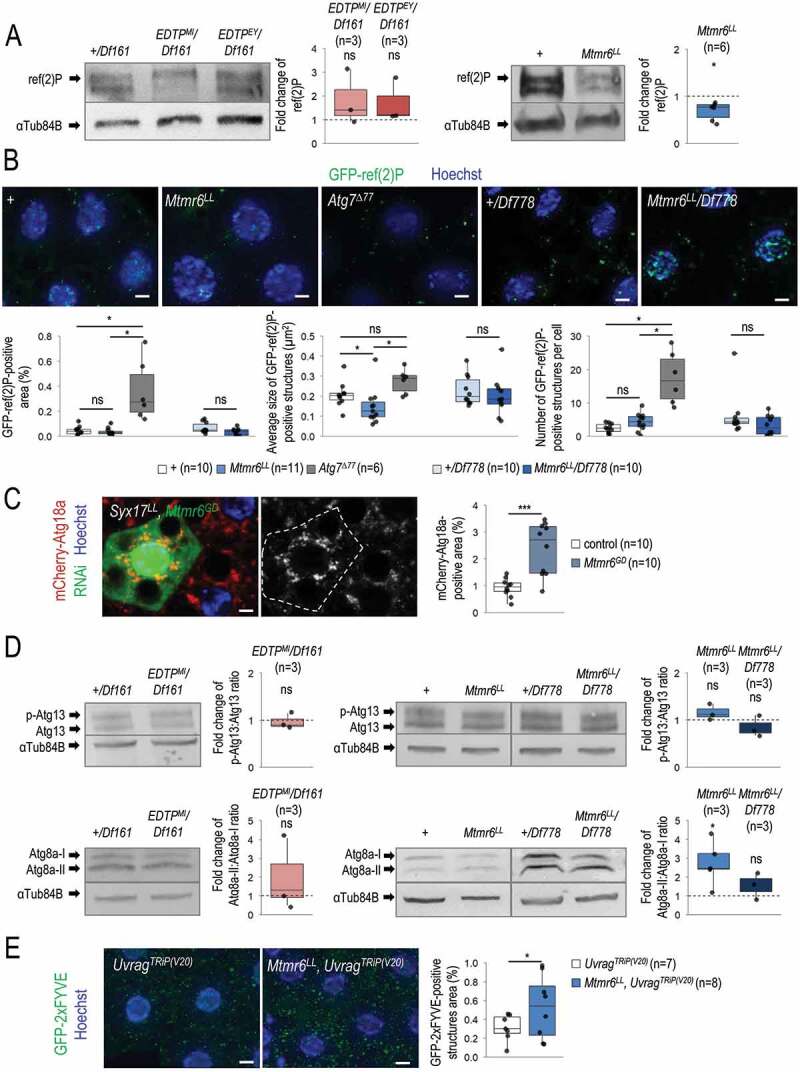
Under starvation, EDTP does not affect, while Mtmr6 inhibits autophagy. (A) In nutrient-deprived animals, the level of soluble ref(2)P is not modulated significantly by EDTP deficiency, but becomes decreased in samples defective for Mtmr6 (western blot analysis). (B) In Mtmr6 mutant genetic backgrounds, the area ratio of insoluble GFP-ref(2)P-containing protein aggregates is not altered significantly but the size of structures is lowered. Atg7Δ77, as a mutant background deficient in autophagosome formation, was also involved in comparison. (C) Clonal silencing of Mtmr6 markedly elevates the quantity of mCherry-Atg18a-positive early autophagic structures in Syx17LL mutant fat bodies, which are defective for autophagosome-lysosome fusion. Clonal cells (green) treated with RNAi are outlined by a white dotted line and also expressed Dcr-2. Analysis was performed by using hsFLP; Syx17LL, r4-mCherry-Atg18a, Act<CD2< Gal4, UAS-nlsGFP animals. (D) The ratio of hyperphosphorylated and non-hyperphosphorylated Atg13 levels is not altered in either EDTP or Mtmr6 mutant samples as compared to controls, indicating that the activity of the induction complex is not influenced. In fat body cells, Atg8a-II:Atg8a-I ratio is not changed in EDTP mutants but becomes increased in Mtmr6 mutant animals as compared to control. Atg8a-I is a cytosolic, Atg8a-II is a membrane-bound form. (E) Mutation of Mtmr6 elevates the quantity of GFP-2xFYVE-positive structures in Uvrag-silenced cells, in which only the autophagy-specific PtdIns3K complex is active. GFP-2xFYVE bounds PtdIns3P and labels only early autophagic structures in Uvrag-silenced cells. UAS-GFP-2xFYVE transgene is expressed by Cg-Gal4 driver. In panels A, B and D, “+” indicates w1118 mutant larvae. In panels A and D, αTub84B was used as an internal control. In panels B, C and E, Hoechst staining (blue) indicates nuclei, and scale bar: 10 μm. Fluorescence microscopy images were composed of multiple optical sections. Quantifications are shown in boxplots, *: p < 0.05, ***: p < 0.001, ns: not significant (for statistics, see the Materials and Methods section). Fat bodies were prepared from starved animals at the third instar feeding larval (L3F) stage
