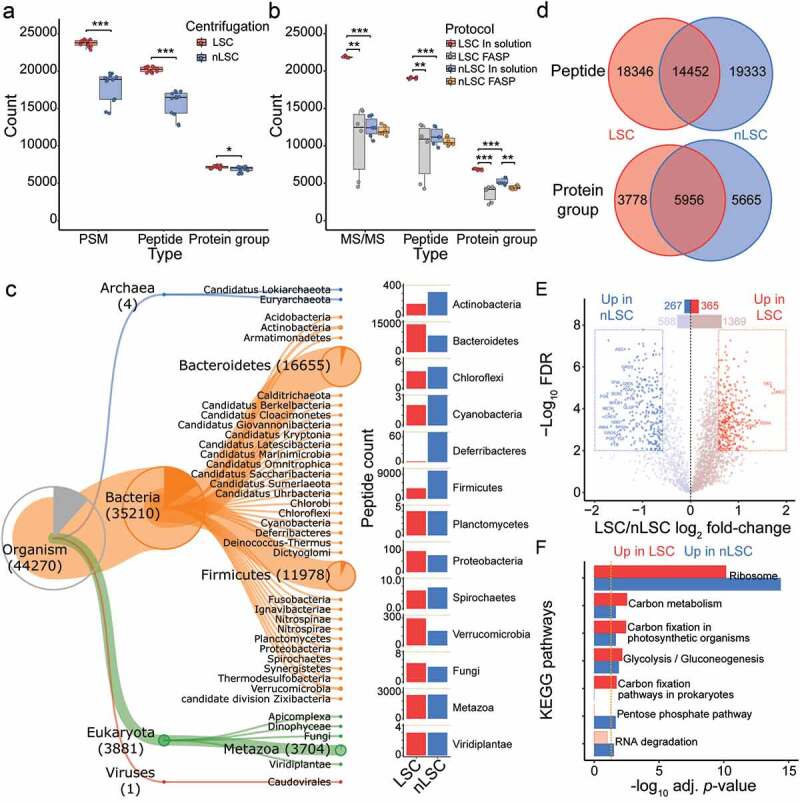
Figure 1.

Low speed centrifugation impacts protein identification and taxonomic representation. (a) Number of MS/MS spectra, peptides and protein groups per samples for the comparison between LSC (red) and nLSC (blue) methods. (b) Number of identified MS/MS spectra, peptides and protein groups per samples for the comparison between LSC-in solution digestion (red), LSC-FASP (gray), nLSC-in solution digestion (blue) and nLSC-FASP (Orange) methods. (a-b) Represented significance results correspond to t-test on N = 12 (a) or N = 6 (b): * p- value ≤ .05, ** ≤.01, *** ≤.001. (c) Hierarchical representation of Unipept-derived taxonomy (down to phylum level) for the peptide identified in the LSC and nLSC. The barplot represent the taxonomic abundance for LSC (red) and nLSC (blue) methods based on peptide counts (only for taxon identified with 3 or more peptides). (d) Overlap in the overall identified peptides or protein groups between the LSC and nLSC methods. (e) Volcano plot of the protein abundance comparison between LSC and nLSC approaches. Significant protein groups based on paired t-test from N = 12 with FDR ≤ .01 and absolute fold-change ≥2.5. (f) KEGG pathways over-representation testing for the protein groups that significantly increase (red) or decrease (blue) in abundance between LSC and nLSC sample preparation approaches. Fisher exact-test threshold (gold dotted line) set to adjusted p-value ≤ .05
