Figure 3.

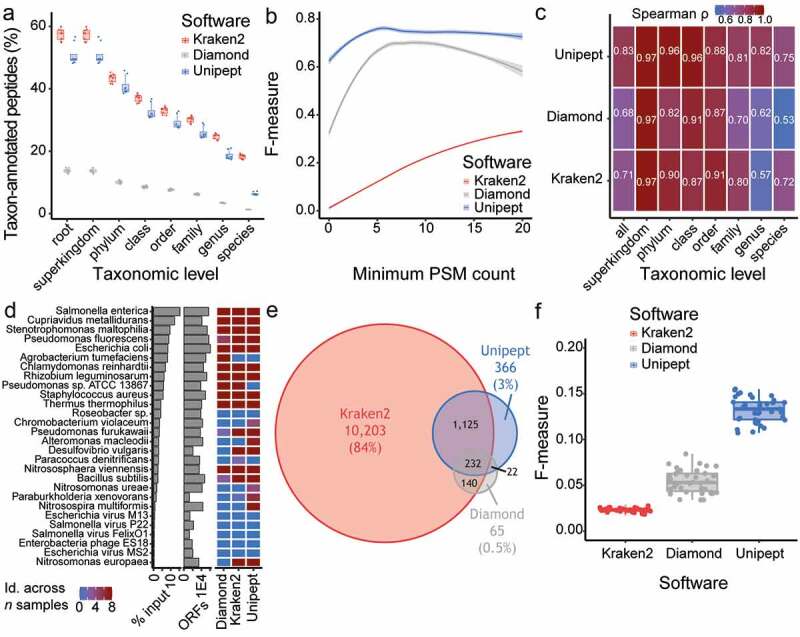
Unipept software provides the most precise taxonomic annotation of MS-based peptide identification. (a) Percentage of taxon-annotated peptides at each taxonomic level for the comparison between Kraken2 (red), Diamond (gray) and Unipept (blue) software. (b) Assessment of the impact of the minimum number of PSM count per taxon onto the F-measure for taxonomic annotation. The F-measure was compared between Kraken2 (red), Diamond (gray) and Unipept (blue) software. (c) Heatmap representing the correlation (Spearman ρ) in taxonomic abundance between sample input protein (expectation) and different taxonomic annotation software (i.e. Kraken2, Diamond and Unipept). The correlation was performed overall, as well as for each taxonomic level. (d) Organisms pooled in artificial samples are ranked based on the protein material input, as displayed in the left-most barplots (x-axis in log10 scale). The proteome size (ORFs) for these organisms on UniProt web resource is displayed in the right-most barplot (x-axis in log10 scale). The heatmap compares the taxon identification across samples between Kraken2, Diamond and Unipept. (a-d) Samples from the study by Kleiner and colleagues, with N = 8. (e) Overlap in the overall identified taxa between the Kraken2 (red), Diamond (gray) and Unipept (blue) software. (f) A comparison of the F-measure distribution for taxonomic annotation between the Kraken2 (red), Diamond (gray) and Unipept (blue) software. Each point represents an individual mouse. (e-f) Samples from this study using mouse fecal material, with N = 38
