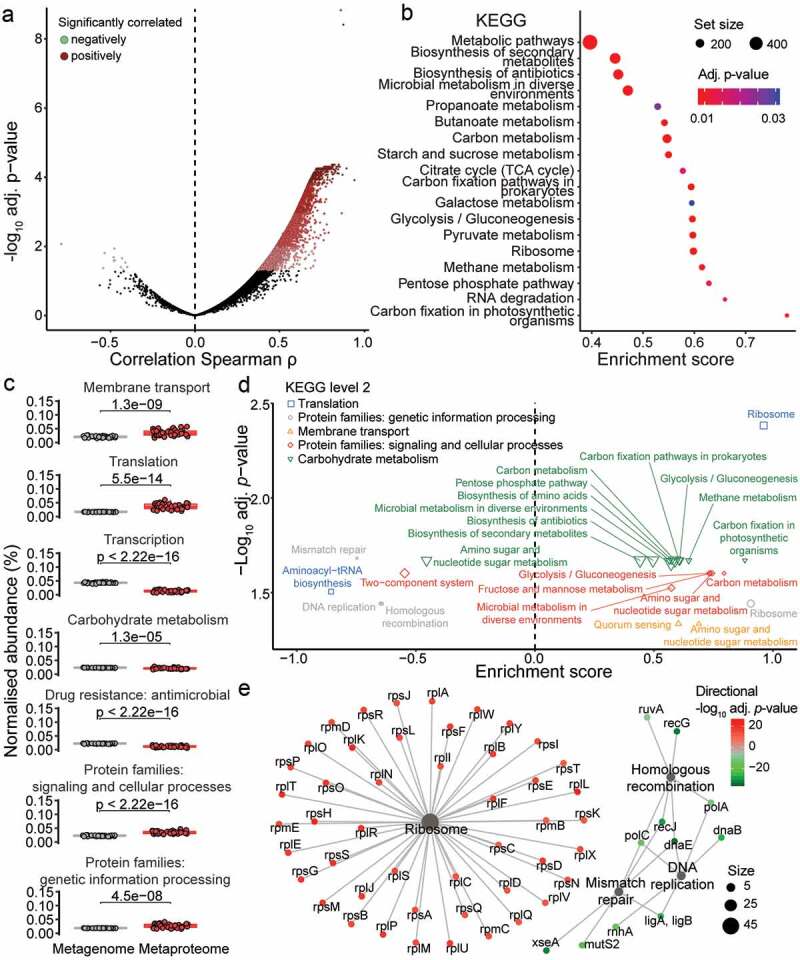
Figure 4.

Functionally active pathways derived from the metaproteome differs from the metagenome potential. (a) Correlation is shown between each protein groups (metaproteome) and corresponding gene “groups” (metagenome) abundances. Correlation was tested using Spearman’s rank correlation and p-value was adjusted for multiple testing using Benjamini-hochberg correction. Significantly positively correlating protein/gene groups are in red colors, while significantly negatively correlating protein/gene groups are in green colors (adjusted p-value ≤ .05). (b) GSEA of KEGG pathways based on ranking of the protein/gene groups correlation. Pathway node color corresponds to GSEA results adjusted p-value and node size matches the number of protein/gene group assigned to the pathway. (c) Comparison in the proportion of selected KEGG functional categories (level 2) between metaproteome (red) and metagenome (gray). Paired t-test p-values are indicated (N = 38). (d) GSEA of KEGG pathways based on ranking of t-test results from KEGG orthology proportion between metaproteome and metagenome. KEGG pathways are color-coded based on KEGG functional categories (level 2). Only significantly over-represented KEGG pathways are shown with adjusted p-value ≤ .05. (e) Interaction network between KEGG orthologies and KEGG pathways for the KEGG functional category “Protein families: genetic information processing”. Pathway node size corresponds to number of KEGG orthologies associated to it. KEGG orthologies are color-coded based on directional adjusted p-value from the t-test comparison between metaproteome and metagenome
