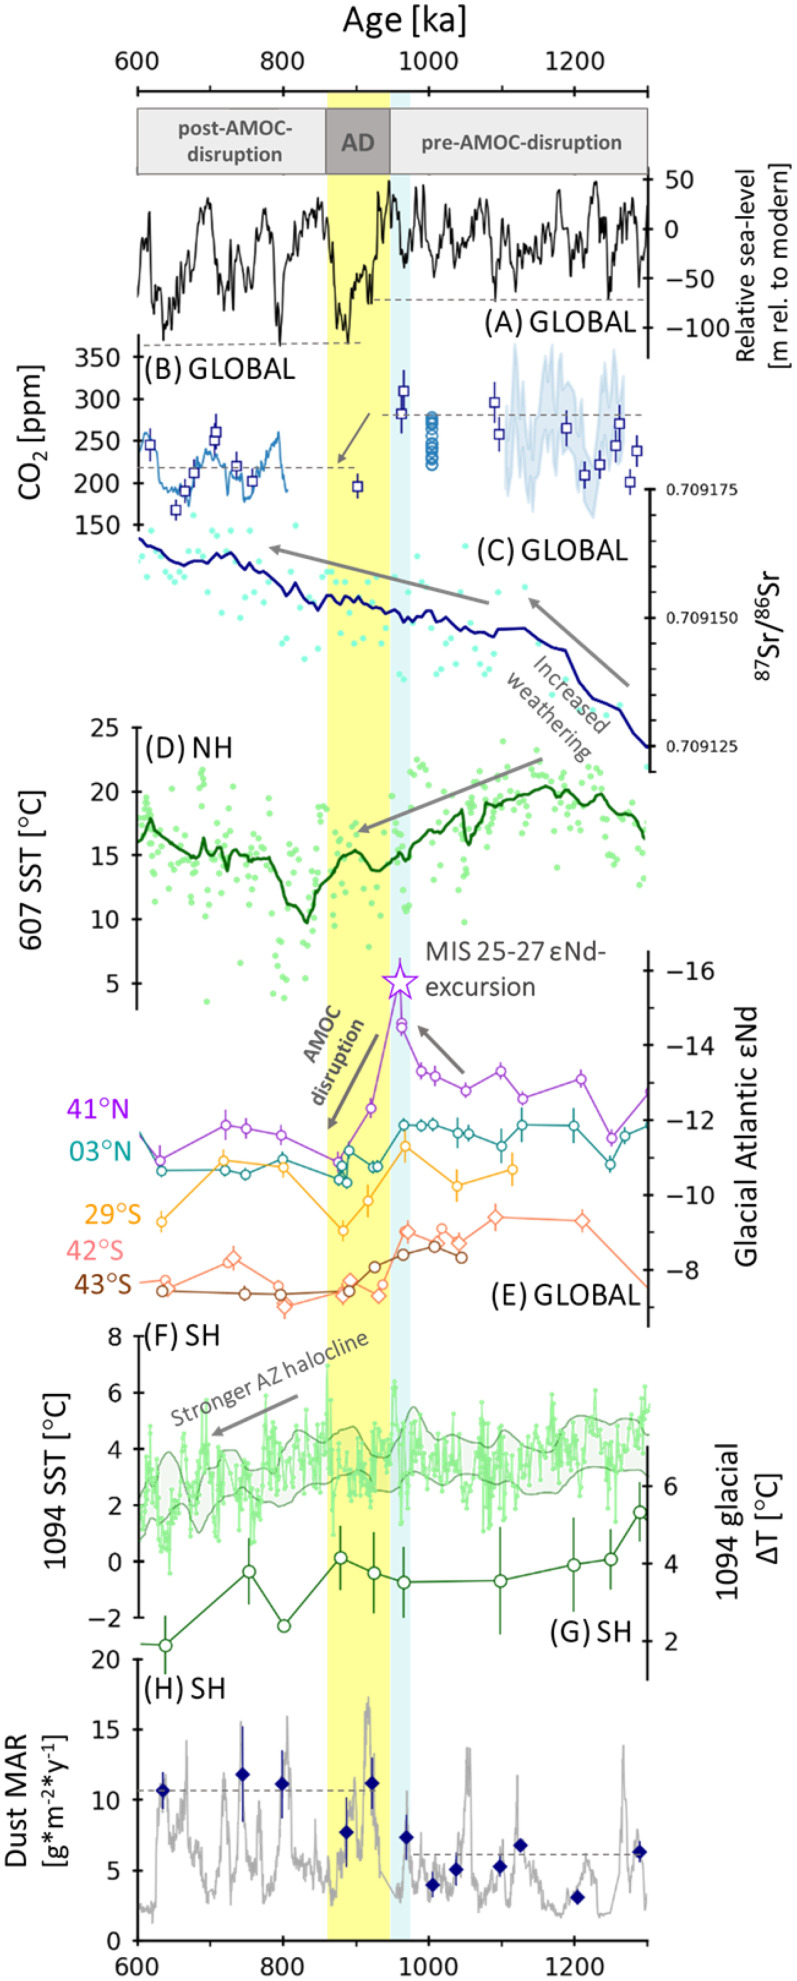
Fig. 6.
Timing of global, Northern Hemisphere (NH), and Southern Hemisphere (SH) MPT-related changes. (A) Sea level changes (modified after ref. 8). Black dashed lines indicate the sea level/ice volume changes for glacial maxima before and after the MPT-AMOC disruption. (B) CO2 changes from EPICA-DOME-C (blue line; ref. 85), Alan Hills (blue circles; ref. 86), and boron isotope data (shaded light blue and navy squares; refs. 12 and 17). The dashed lines indicate average CO2 before and after the MPT-AMOC disruption. The arrow indicates the timing of the main CO2 drop during the 900-ka event. (C) Global sea water 87Sr/86Sr ratios recorded at DSDP Site 758 (84). The arrows mark the increase in weathering rates over the pre-AMOC-disruption period (the change in slope is shown more distinctly in Figs. 3 and 4). The dark blue line represents smoothing over a ∼40-ky window. (D) Sea surface temperatures (SST) from Site 607 (3, 87), showing decreasing SST prior to the 900-ka event. The dark green line represents smoothing over a ∼23-ky window. (E) εNd of the transect for glacial maxima, including data from this study and published works (7, 22, 79, 88). The MIS-27-to-25 εNd excursion and effects of the MPT-AMOC disruption are clear in Site 607. (F) SST from the Antarctic Zone (AZ; ref. 11) Site 1094. The dark green line is as in D and shows a later occurring and a more gradual decrease in Southern Hemisphere SST. (G) SST and bottom water temperature gradients from Site 1094 (11). (H) Sub-Antarctic Zone iron-based dust flux (gray line; ref. 89). The blue diamonds represent binned averages of glacial iron flux maxima (90). The dashed lines represent average fluxes before and after the MPT-AMOC disruption. The vertical shaded yellow area represents the MPT-AMOC disruption, which represents a major change in the meridional Atlantic water-mass structure and a weakening of the NSW influence (abbreviated as AD; ref. 7). The shaded blue band represents the MIS-27-to-25 εNd excursion.

