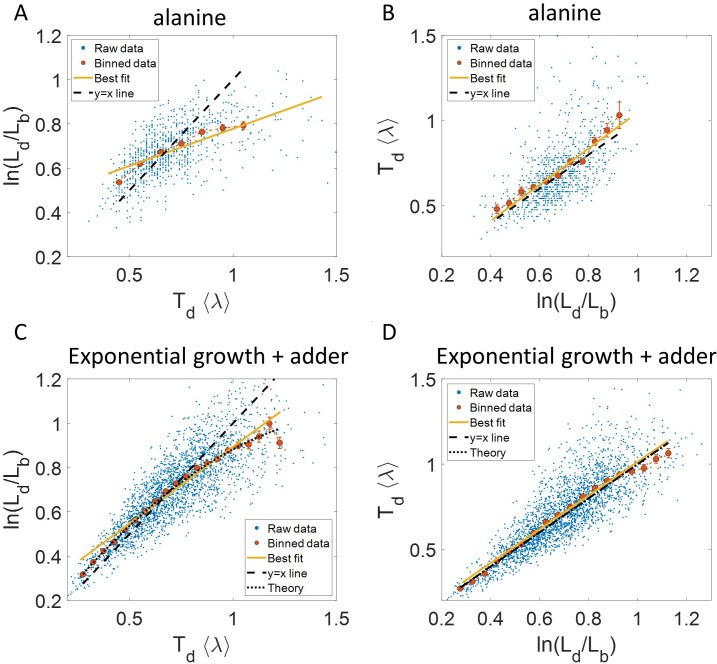
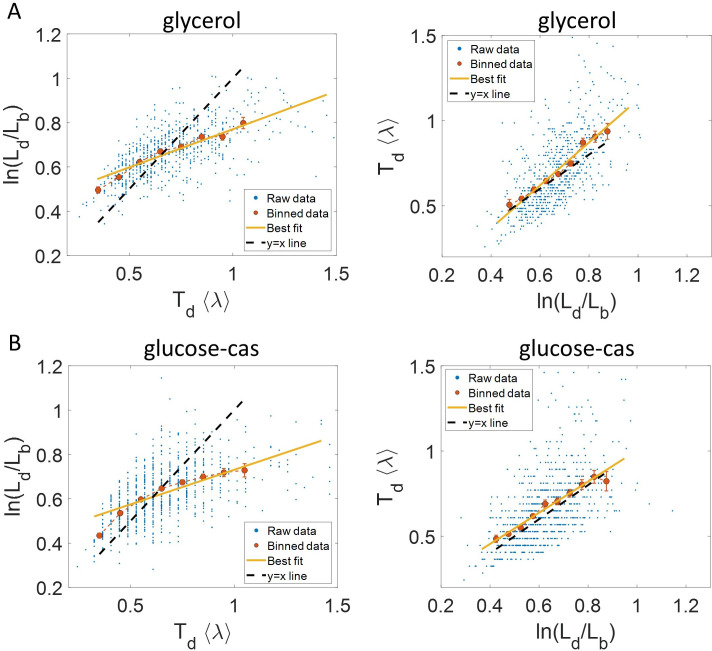
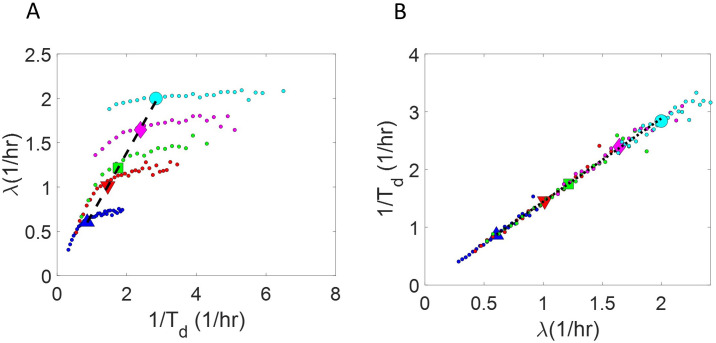
Figure 2. Plots that could potentially lead to misinterpreting exponential growth.
(A, B) Data is obtained from experiments in M9 alanine medium ( = 214 min, N = 816 cells). (A) vs plot is shown. The blue dots are the raw data, the red correspond to the binned data trend, the yellow line is the best linear fit obtained by performing linear regression on the raw data and the black dashed line is the y = x line. A priori, non-linear trend in binned data might point to growth being non-exponential. (B) vs plot is shown for the same experiments. (C, D) Simulations of exponentially growing cells following the adder model are carried out for N = 2500 cells. The parameters used are provided in the Simulations section. (C) vs plot is shown. The trend in binned data shown in red is non-linear and the best linear fit of raw data (yellow) deviates from the y = x line (black dashed line). The black dotted line is the expected trend obtained from theory (Equation 2). For parameters used in the simulations here, the black dotted line follows . (D) vs plot is shown with binned data in red and the best linear fit on raw data in yellow closely following the expected trend of y = x line (black dashed line). The theoretical binned data trend (black dotted line) is expected to follow the y = x trend. In all of these plots, the binned data is shown only for those bins with more than 15 data points in them.


