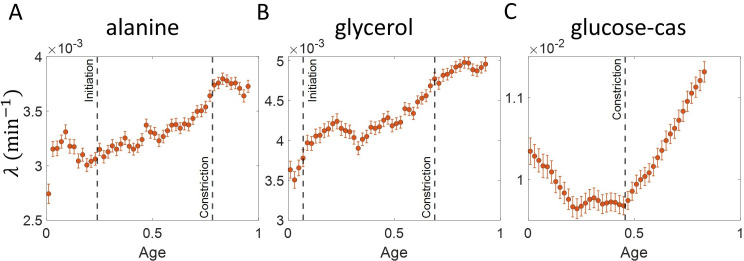
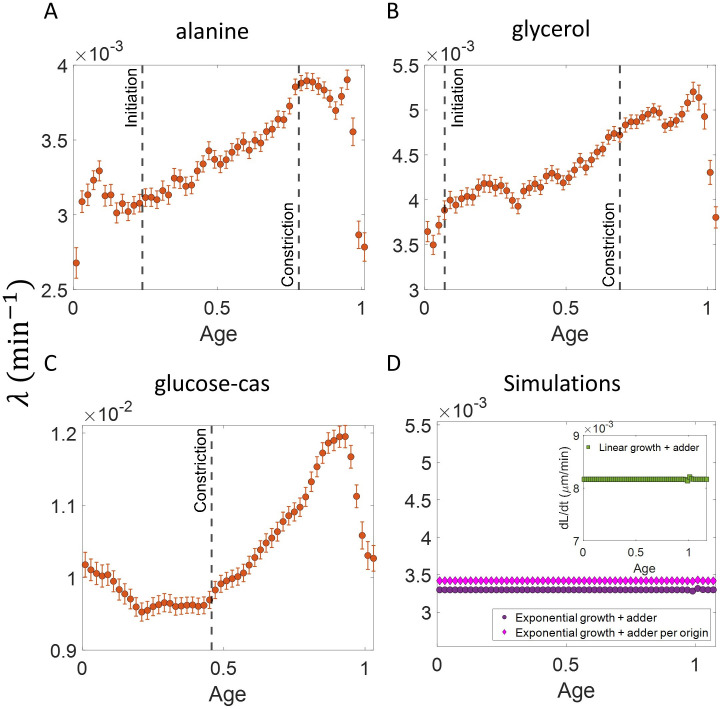
(
A,B,C) The binned growth rate trend is shown in red as a function of age for
E. coli experimental data. The trends are obtained using the cell size trajectories extending beyond the division event (age >1). The plots are shown for (
A) Alanine medium (N = 720 cells) (
B) Glycerol medium (N = 594 cells). (
C) Glucose-cas medium (N = 664 cells). The error bars in all three plots represent the standard deviation of the growth rate in each bin scaled by
, where N is the number of cells in that bin. The growth rate trend appears to be periodic in each of the growth media that is,
at age ≈one is close to
at age ≈ 0. These trends agree with that of
Figure 4 in the appropriate age ranges. (
D) Simulations are carried out for N = 2500 cell cycles. The cell size trajectories are collected beyond the division event (age >1). The binned data trend for growth rate vs age plot is shown as purple circles for exponentially growing cells following the adder model. We observe the trend to be nearly constant as expected for exponential growth. The binned growth rate trend is also found to be nearly constant for the simulations of exponential growing cells following the adder per origin model (shown as magenta diamonds). (Inset) Shown as green squares is the elongation speed vs age plot for simulations of N = 2500 cell cycles of linearly growing cells following the adder model. As expected for linear growth, the binned elongation speed trend remains approximately constant with age. The growth rate trends for the models with exponential growth agree with that of
Figure 3B. The elongation speed trend (inset) also agrees with the trend in
Figure 3—figure supplement 3.


