Fig. 3.
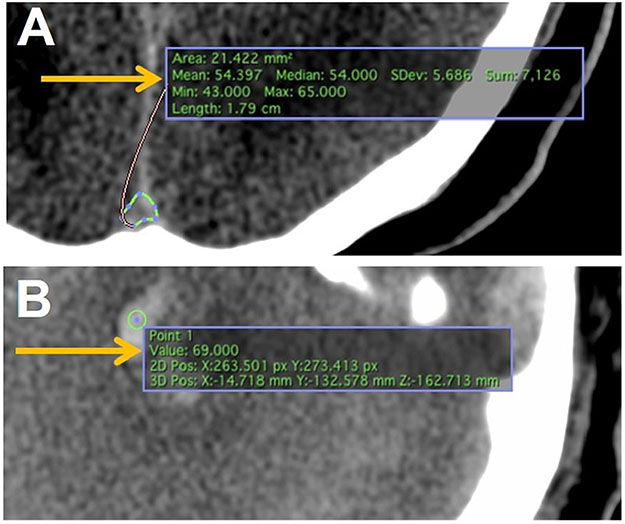
Hounsfield unit normalization across computed tomography (CT) images. a Tracing feature in Osirix MD allows the user to trace the superior sagittal sinus just before entry into the torcula. “Mean” (arrow) indicates the mean Hounsfield unit value for the tracing, which was used as the baseline threshold for suspected lesions. b The point-measure feature allows the user to test individual pixels within an image. “Value” (arrow) indicates the Hounsfield unit value for that pixel. Three contiguous pixels above threshold qualified as lesions for measurement. Volume larger than 0.025 cm3 qualified as lesions for inclusion in statistical analysis

