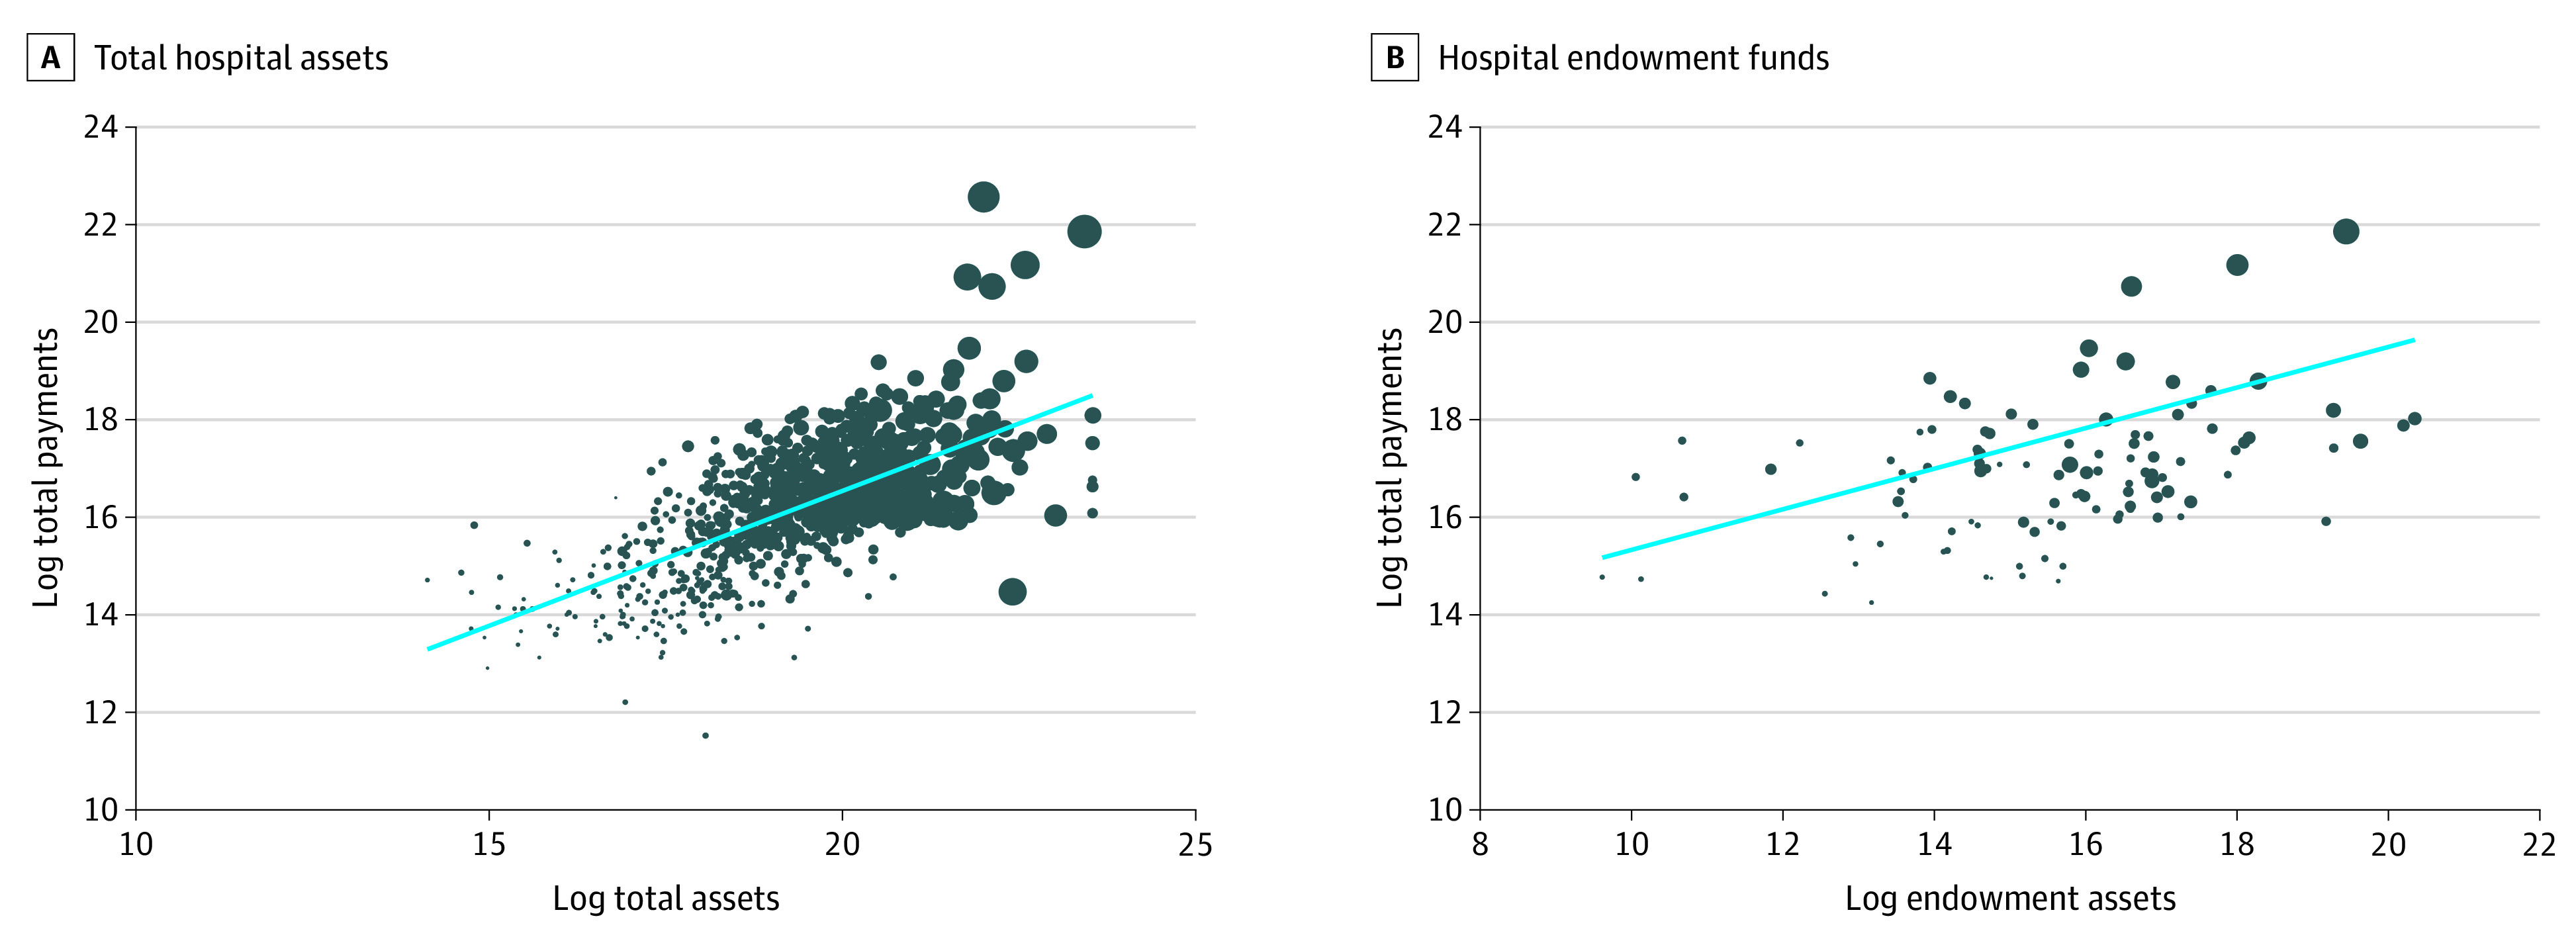
Figure 2. Distribution of Log-Transformed CARES Act Funding and Hospital Assets.

A, Total hospital assets; B, Hospital endowment funds. Authors’ analysis of matched Coronavirus Aid, Relief, and Economic Security (CARES) Act and Centers for Medicare & Medicaid Services Hospital Cost Report data. The dot weighting reflects total discharge equivalents for each hospital. The blue line is the regression line between the 2 variables. For A, the slope is 0.61; for B, 0.42.
