FIGURE 3.

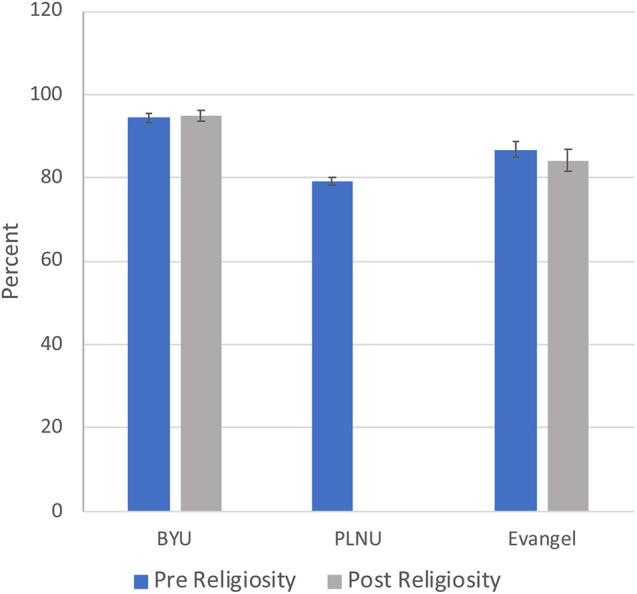
Pre and post religiosity at each institution. Religiosity is measured on a 75-point scale. Scores have been left raw. Error bars represent the standard error of the mean.

Pre and post religiosity at each institution. Religiosity is measured on a 75-point scale. Scores have been left raw. Error bars represent the standard error of the mean.