
Figure 2.
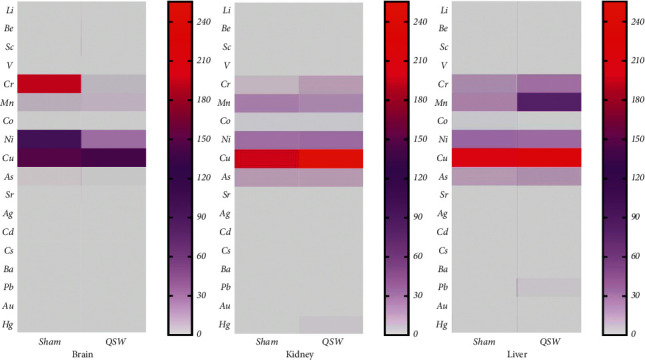
Heatmap of 18 elements in the brain, kidney, and liver (n = 6). (Note. The redder the color, the higher the content; the grayer the color, the lower the content.)
Official websites use .gov
A
.gov website belongs to an official
government organization in the United States.
Secure .gov websites use HTTPS
A lock (
) or https:// means you've safely
connected to the .gov website. Share sensitive
information only on official, secure websites.
Heatmap of 18 elements in the brain, kidney, and liver (n = 6). (Note. The redder the color, the higher the content; the grayer the color, the lower the content.)