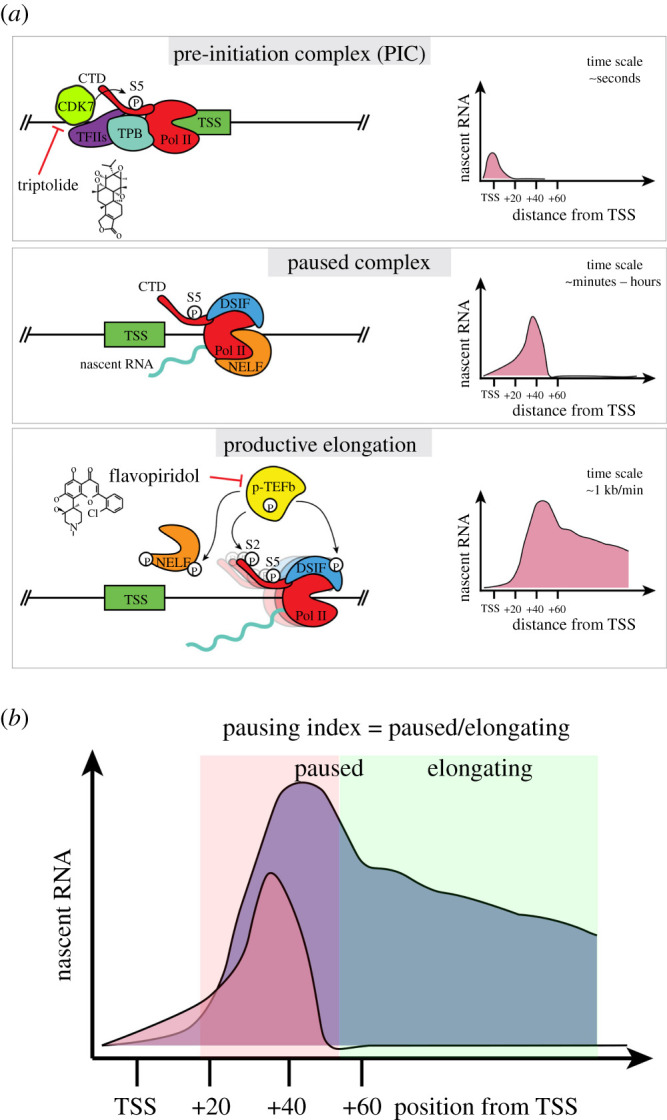
Figure 1.

Stepwise activation of mammalian transcription. (a) Illustration of three steps leading to active gene transcription along with key complexes involved and example profile of nascent transcription levels along the gene body. (b) Illustration of pausing index, a commonly used metric to determine degree of Pol II pausing at a particular gene.
