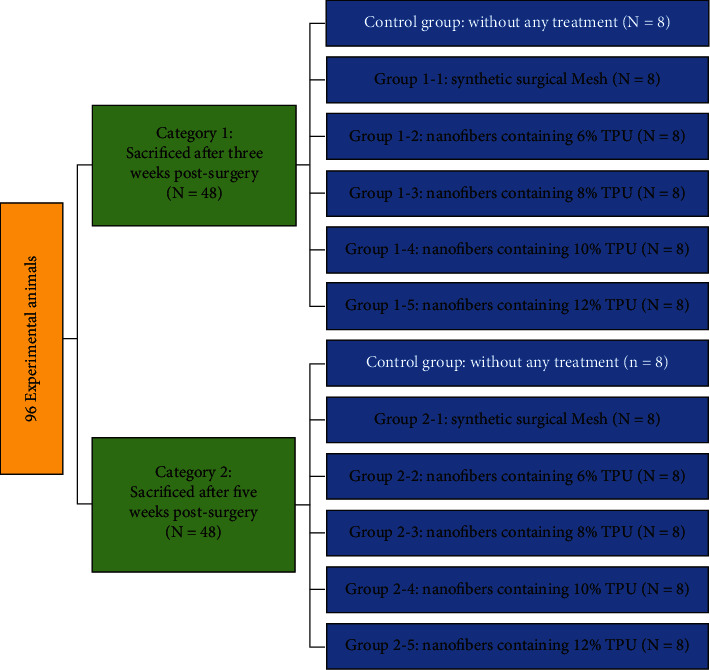
Figure 1.

Schematic diagram of the classification of experimental rats in 10 groups. The classification of 80 experimental animals into 2 experimental categories contains 5 experimental groups with 8 rats in each group. We compared cytokine levels 3 weeks and 5 weeks after experimental abdominal surgery to a control group.
