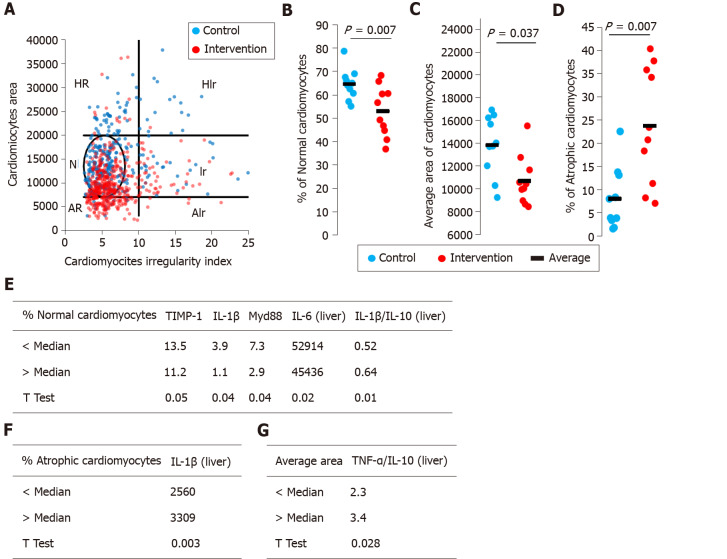
Figure 2.
Cardiomyocytes morphometric analysis. The area and cross-sectional shape of cardiomyocytes were determined from images of hematoxylin and eosin-stained tissue. A: Dot plot of cardiomyocyte area vs cardiomyocyte irregularity index in control (blue) and intervention (red) groups. Each dot represents a population of cardiomyocytes with different morphometry. N–normal area and shape, Ir–normal area and irregular shape, HR–hypertrophic and regular cardiomyocytes, HIr–hypertrophic and irregular cardiomyocytes, AR–atrophic and regular cardiomyocytes, AIr–atrophic and irregular cardiomyocyte; B: Average area of cardiomyocytes; C: Percentage of normal cardiomyocytes; D: Percentage of atrophic cardiomyocytes; E-G: We segregated the animals in the intervention group into two subgroups and the data were compared. IL: Interleukin; TNF: Tumor necrosis factor.

