
Figure 3.
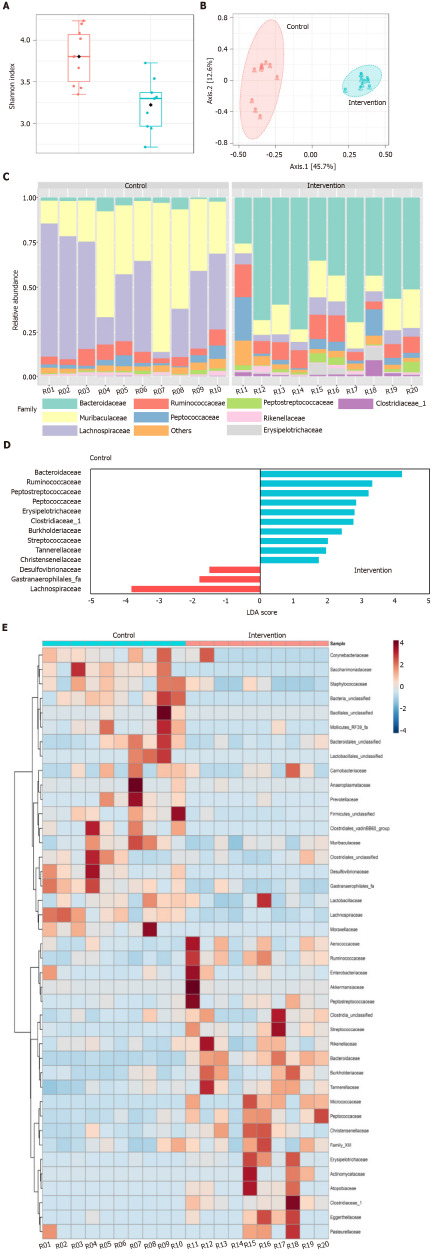
Gut microbiota changes in intervention and control groups. A: Shannon diversity index; B: Principal coordinate analysis based on Bray-Curtis distance metric; C: Relative abundance of gut microbiota at the family level; D: Differential abundance by linear discriminant analysis; E: Heatmap distribution of the 41 families among the samples. LDA: Linear discriminant analysis.