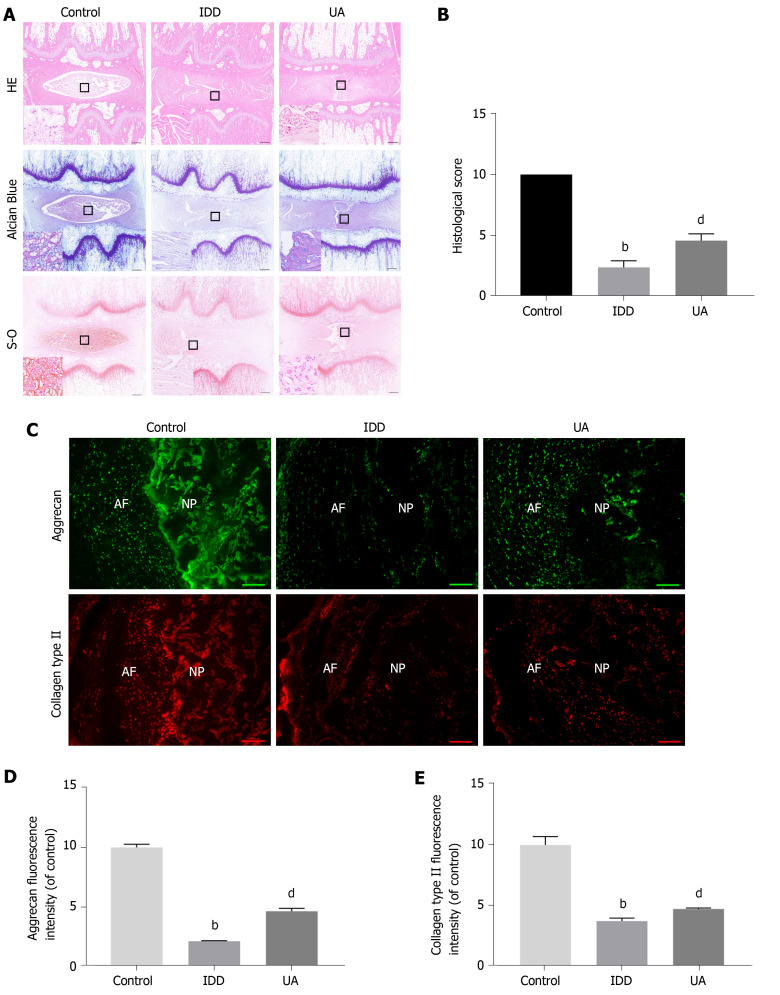
Figure 8.
Hematoxylin-eosin, Safranin-O and Toluidine blue staining. A: Hematoxylin-eosin staining at 4 wk after puncture in different groups; B: Quantitative analysis of histological score in different groups (scale bar = 1 mm); C: The expression of aggrecan and collagen type II in different groups (scale bar = 200 μm); D-E: Quantitative analysis of aggrecan and collagen type II in different groups. All data are expressed as the mean ± SD. aP < 0.05, bP < 0.01 compared with control group; cP < 0.05, dP < 0.01 compared with H2O2 group; eP < 0.05, fP < 0.01 compared with UA group. HE: Hematoxylin-eosin; NP: Nucleus pulposus; AF: Annulus fibrosus; IDD: Intervertebral disc degeneration; UA: Urolithin A.

