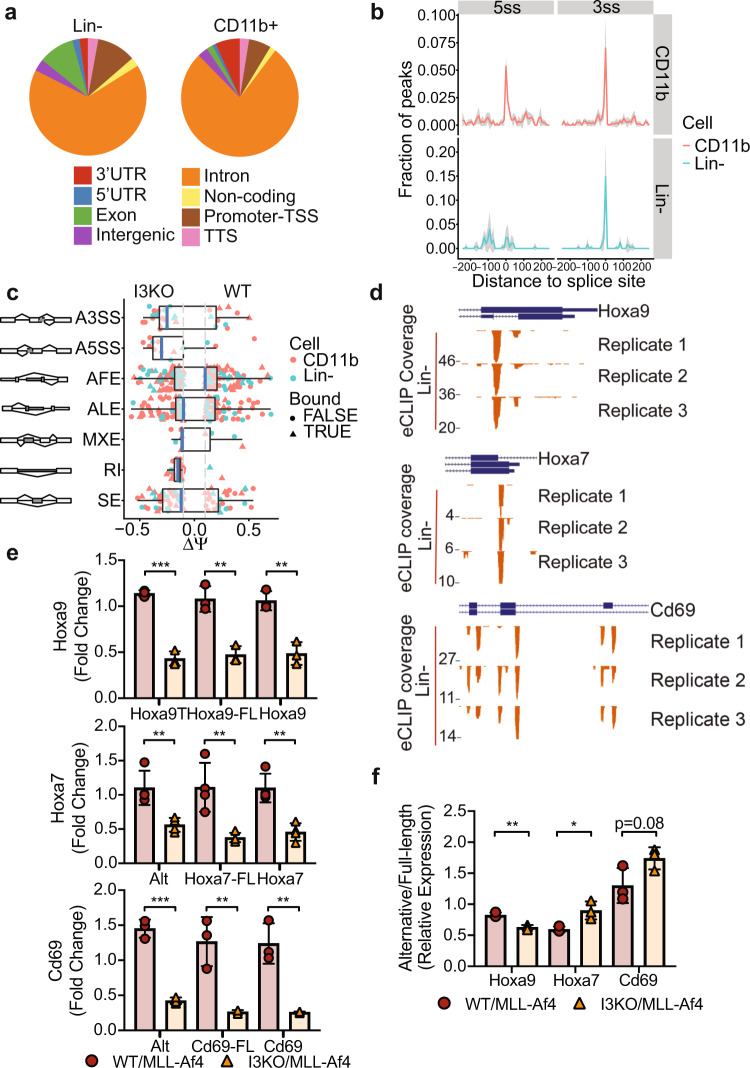
Fig. 6. eCLIP analysis reveals IGF2BP3 function in regulating alternative pre-mRNA splicing.
a Genomic locations of IGF2BP3 eCLIP peaks in WT/MLL-Af4 Lin− cells and CD11b+ cells. Cell type differences in location of exonic peaks were noted: in CD11b+ cells, a greater proportion of exonic peaks were found in 3′UTRs, whereas a greater proportion of peaks mapped to internal exons in Lin− cells. b Histogram showing normalized IGF2BP3 eCLIP peak counts and distance from IGF2BP3 eCLIP peak of 5′ (5ss) and 3′ (3ss) splice sites in WT/MLL-Af4 CD11b+ (top) cells and Lin− cells (bottom). c Distribution of types of alternative splicing patterns for WT/MLL-Af4 or I3KO/MLL-Af4 Lin− and CD11b+ cells using MISO analysis. Delta psi values plotted indicate difference in isoforms. The event types included are the following, with abbreviations: A3SS alternative 3′ splice sites, A5SS alternative 5’ splice sites, AFE alternative first exons, ALE alternative last exons, MXE mutually exclusive exons, RI retained introns, SE skipped exons, Bound IGF2BP3 eCLIP target. d UCSC Genome Browser snapshots of the Hoxa9, Hoxa7, and Cd69 loci. Each panel shows the exon–intron structure of the gene and unique read coverage from three eCLIP biological replicates from WT/MLL-Af4 Lin− cells. The maximum number of reads at each position is indicated to the left of each histogram. e Expression of Hoxa9, Hoxa7, and Cd69 splice variants in WT/MLL-Af4 and I3KO/MLL-Af4 Lin− cells by RT-qPCR utilizing primers which detect only its respective alternative splice isoforms (Hoxa9T, Alt), full-length isoforms (-FL), and both isoforms (n = 3–4; t test; **P < 0.01, ***P < 0.001). f Relative expression ratio of alternative splice isoform to full-length isoform (alternative/full-length) in WT/MLL-Af4 and I3KO/MLL-Af4 Lin− cells by RT-qPCR (n = 3; t test; *P < 0.05, **P < 0.01).

