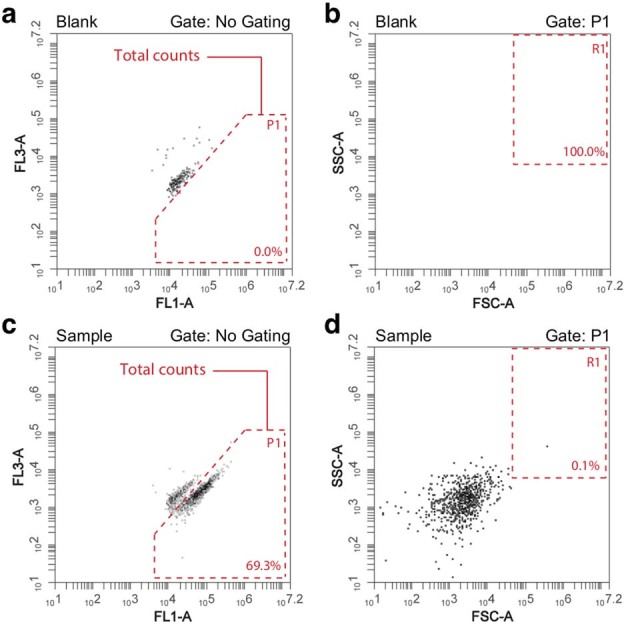
Extended Data Fig. 8. Illustration of flow cytometry gating strategy.

A fixed gating/staining approach was applied. Both blank and sample solutions were stained with SYBR Green I. (a) FL1-A/FL3-A acquisition plot of a blank sample (0.85% w/v physiological solution) with gate boundaries indicated. A threshold value of 2000 was applied on the FL1 channel. (b) Secondary gating was performed on the FSC-A/SSC-A channels to further discriminate between debris/background and microbial events. (c, d) FL1-A/FL3-A count acquisition of a faecal sample with secondary gating on FSC-A/SSC-A channels based on blank analyses. Total counts were defined as events registered in the FL1-A/FL3-A gating area excluding debris/background events observed in the FSC-A/SSC-A R1 gate. The flow rate was set at 14 microliters per minute and the acquisition rate did not exceed 10,000 events per second. Each panel reflects the events registered during a 30 s acquisition period. Cell counts were determined in duplicate starting from a single biological sample.
