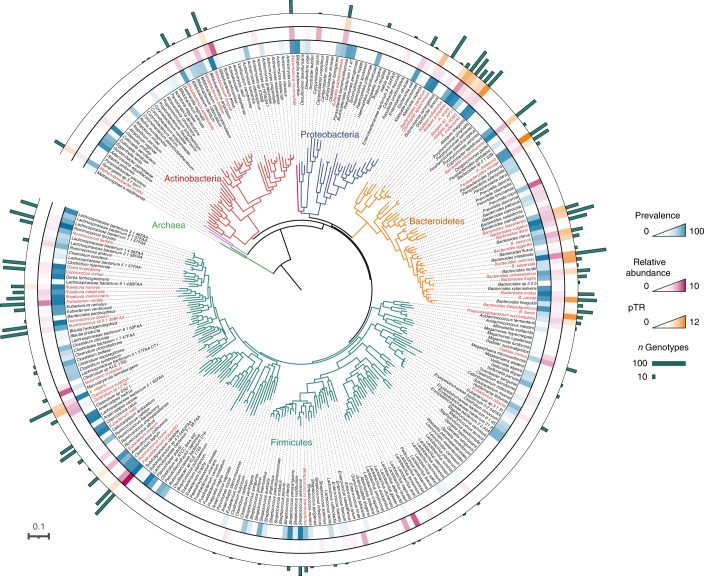
Fig. 2. Maximum likelihood phylogenetic tree of the CGC species profiled in this study.
All species detected within the CGC cohort and present in the PhyloPhlAn default database are shown; species profiled using StrainPhlAn are shown in red. Branches are coloured by phylum (Actinobacteria, red; Archaea, green; Bacteroidetes, yellow; Firmicutes, dark green; Proteobacteria, blue; Verrucomicrobia, pink), with the outer circles representing scaled prevalence (blue), relative abundance (percentage, pink) and pTRs (yellow). The number of genotypes recovered for each species is represented by bar plots (green).

