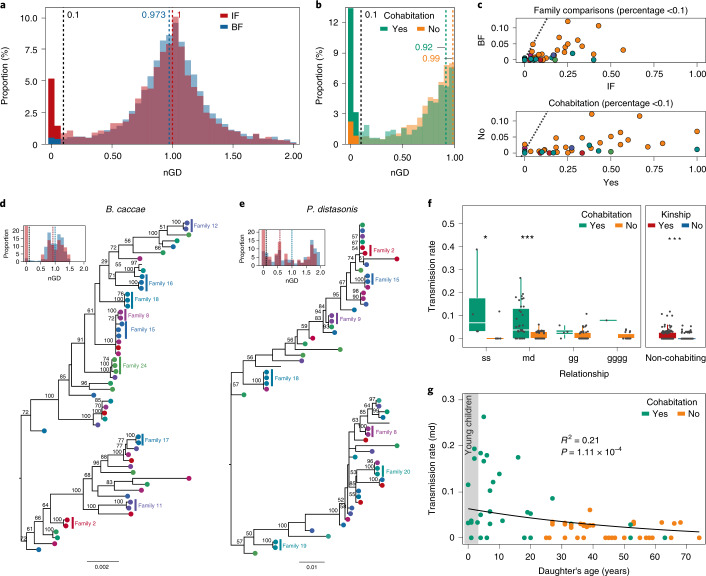
Fig. 3. Transmissions of genotypes across family members.
a, nGDs between all pairs of genotypes recovered. IF distances (red) present a lower overall median compared with BF distances (blue). b, nGDs for cohabiting individuals peak towards nGD = 0. c, Proportion of total pairwise comparisons with nGDs < 0.1. Top: Comparisons based on relatedness, with higher proportions of IF (x axis) compared with BF (y axis) for all taxa. Bottom: Cohabitation-based comparisons, with cohabiting (x axis) participants showing higher proportions compared to non-cohabiting (y axis) individuals. Taxa are coloured by phylum (Actinobacteria, red; Bacteroidetes, yellow; Euryarchaeota, green; Firmicutes, blue; Proteobacteria, violet; Verrucomicrobia, pink). The dashed line indicates 1:1 proportions. d,e, Maximum likelihood phylogenetic trees of species exhibiting the highest number of IF transmissions (Supplementary Table 13): B. caccae (d) and P. distasonis (e). Nodes are coloured by family ID (colour-coded as in Fig. 1a); family members that exchange strains are shaded. The vertical lines in the histograms indicate nGDs for IF (red) and BF (blue). f, Left: pTRs by relationship (ss, sister; md, mother–daughter; gg, grandmother–granddaughter; gggg, great-grandmother–great-granddaughter) and cohabitation status (green = yes, yellow = no) (Wilcoxon rank-sum test, n = 102, *Padj < 0.05, ***Padj < 0.001; Supplementary Table 15). Right: pTRs by kinship for non-cohabiting individuals (Wilcoxon rank-sum test, n = 94, r = 0.24, P = 5.85 × 10⁻⁵). The body of the box plot represents the first and third quartiles of the distribution and the median line. The whiskers extend from the quartiles to the last data point within 1.5× the IQR, with outliers beyond. g, The pTR between mothers and daughters decreases with the daughter’s age (n = 78 pairs, beta regression, R2 = 0.21, z = −3.87, P = 1.11 × 10⁻⁴).

