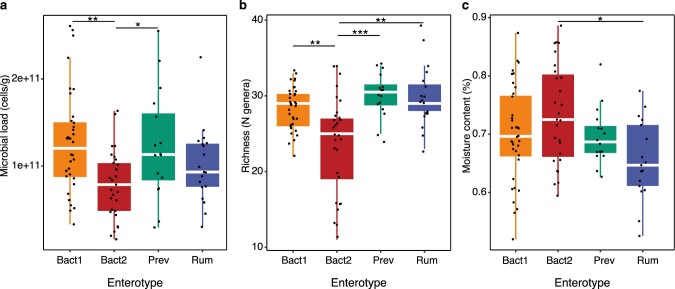
Extended Data Fig. 2. Enterotype associations with microbial load, richness, and moisture content.
(a) Reduced microbial load (microbial cells per gram of stool) in Bact2 enterotyped samples; N = 101, KW test Chi2 = 13.9, P = 3.0e-03; phD tests, adjP<0.001(***), <0.01(**), <0.05(*); Supplementary Table 3. (b) Reduced richness (number of genera) in Bact2 enterotyped samples; N = 101, KW test Chi2 = 20.0, P = 1.6e-04; phD tests, adjP<0.001(***), <0.01(**), <0.05(*); Supplementary Table 3. (c) Increased stool moisture content (%) in Bact2 enterotyped samples; N = 101, KW test Chi2 = 8.8, P = 0.03; phD tests, adjP<0.001(***), <0.01(**), <0.05(*); Supplementary Table 3. The body of all box plots represent the first and third quartiles of the distribution and the median line. The whiskers extend from the quartiles to the last data point within 1.5× the interquartile range, with outliers beyond.

