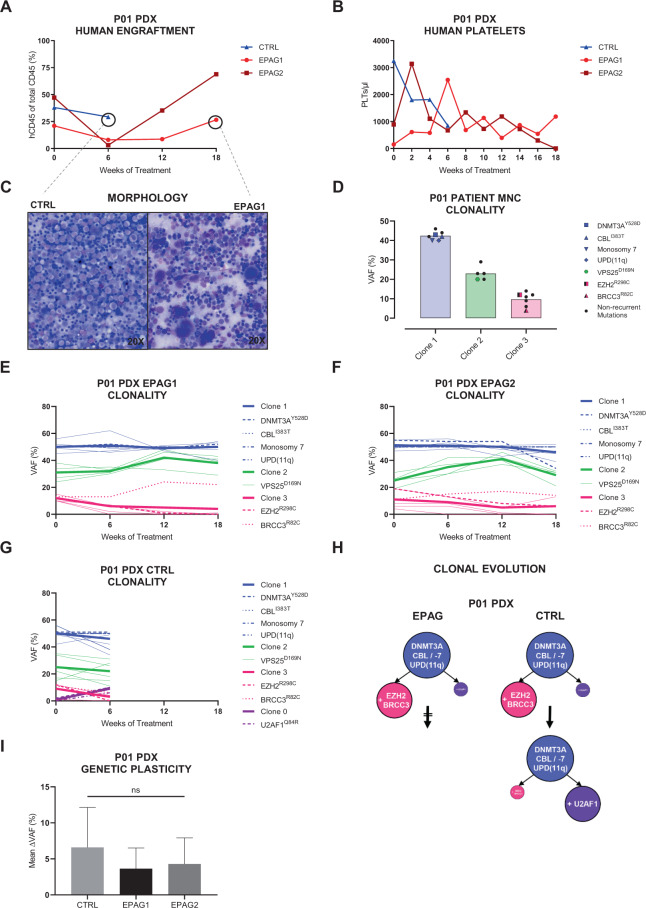
Fig. 2. Exemplary complete overview of comprehensive clinical and molecular readouts of patient P01 and its xenografts.
Of n = 3 xenografts, n = 2 were treated with eltrombopag (EPAG1 + 2, red) and n = 1 received vehicle control (CTRL, blue). CTRL mouse had to be killed 6 weeks into treatment phase due to excessive weight loss (see Supplementary Fig. S3). A Percentage of human engraftment in the bone marrow (BM) of xenografts throughout 18 weeks of treatment. Engraftment was assessed every 6 weeks. B Course of human platelets (PLTs) in the peripheral blood of xenografts during treatment phase. PLTs were analyzed every 2 weeks. C BM smears of CTRL (left) and EPAG1 (right) at endpoint stained with May–Grünwald–Giemsa stain (magnification ×20). D Mutational variant allele frequencies (VAFs) of primary mononuclear cell (MNC) sample of patient P01. Each bar represents one individual clone. Non-synonymous mutations are displayed with their superscripted respective amino acid change. E–G VAFs of patient-specific mutations in the course of treatment detected in the BM of EPAG1, EPAG2, and CTRL, respectively. Mutations were separated into different subclones using the bioinformatic tool SciClone. MDS-associated molecular lesions are highlighted. Thicker lines represent the mean value of the respective clone. H Reconstruction of differential clonal evolution in the xenografts of P01 for both treatment groups. I Mean deltaVAF of EPAG1, EPAG2, and CTRL determined from all identified somatic mutations for any two consecutive WES time points. Data were analyzed using one-way ANOVA and are represented as mean ± SD. ns, not significant.

