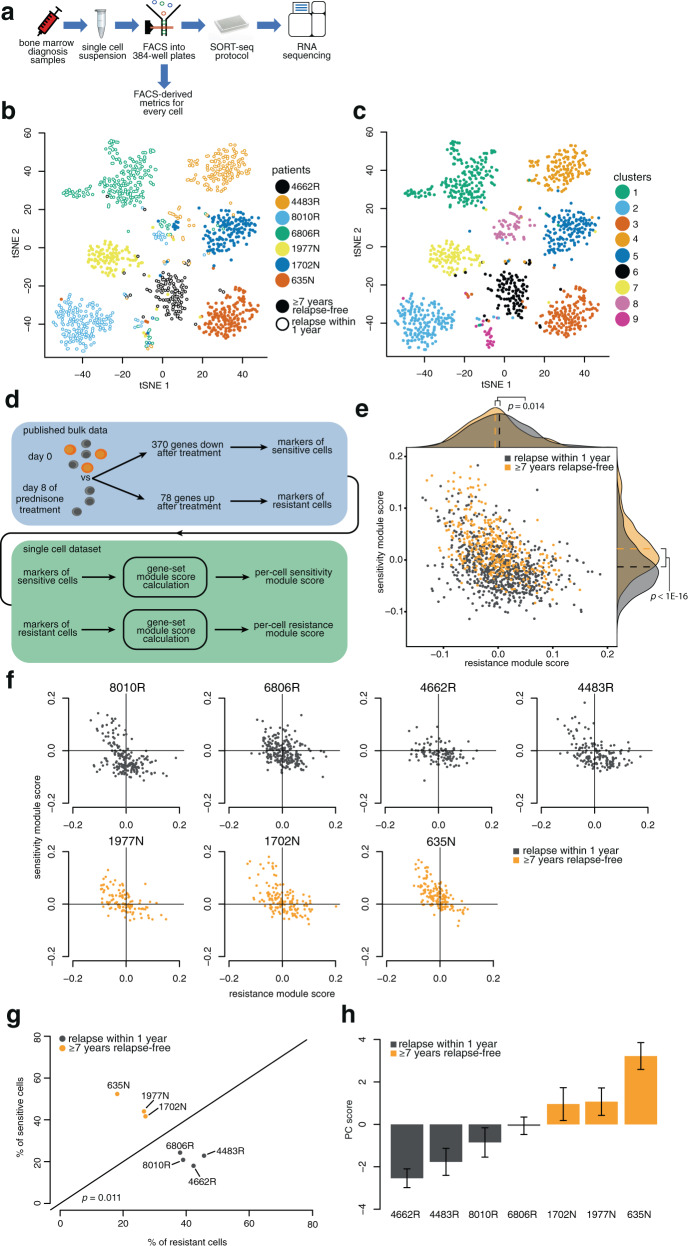
Fig. 1. Single-cell drug-sensitivity classification leads to relapse prediction.
a Experiment design. b t-distributed stochastic neighbor embedding (t-SNE) plot of cells labeled according to sample ID, with R indicating patients who suffered relapse and N indicating no relapse. c Louvain clustering24 projected onto the t-SNE plot. d Previously published differential expression data obtained comparing naive and prednisone-treated samples26 were applied as gene modules to classify cells for sensitivity (downregulated genes) and resistance (upregulated genes). e Gene module scores (x- and y-axis) for each cell, with cells from patients who later developed relapse labeled gray and cells from relapse-free patients labeled orange. f Gene module scores for cells from each patient individually. Cells in the upper-left quadrant are predicted to be more sensitive and in the bottom-right more resistant to treatment. g Quantification of the fraction of cells from each patient (from f) predicted to be sensitive (y-axis) or resistant (x-axis). h First principal component (PC) calculated using the union of sensitive/resistance module genes for each cell. Bar height represents the mean score per patient. Error bars represent standard error of the mean.

