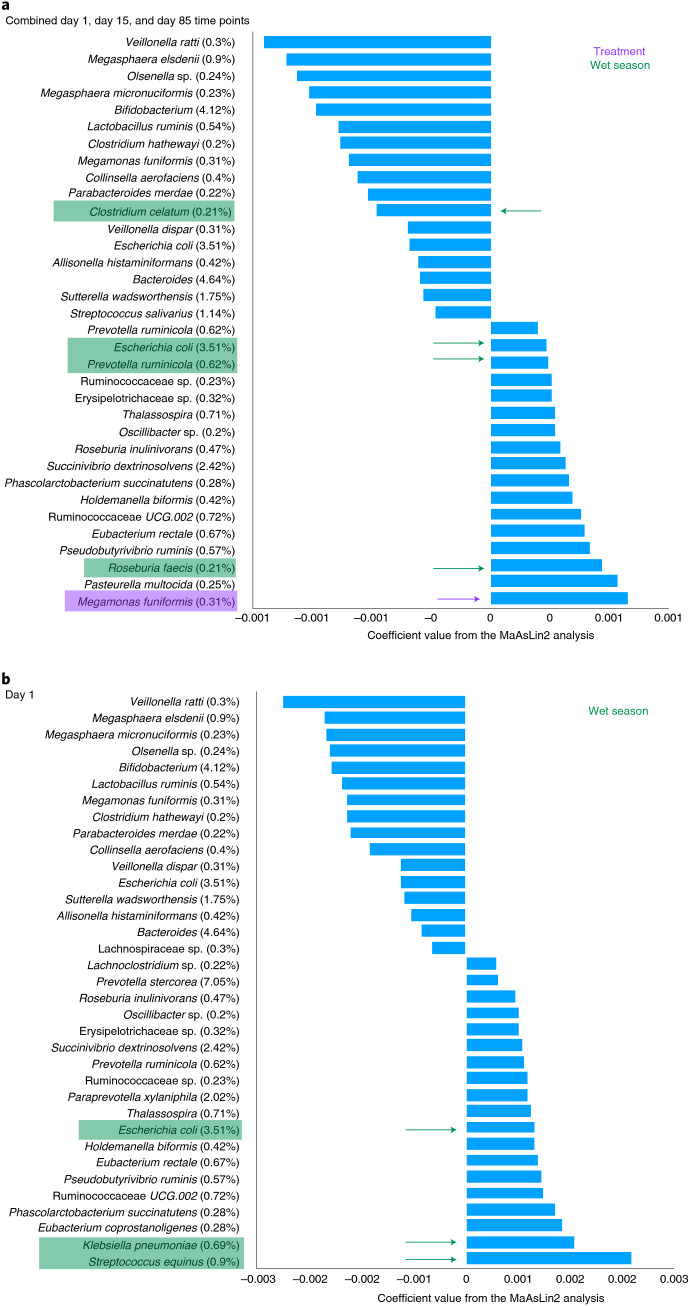
Fig. 1. Multivariable statistical analysis to identify taxa associated with age, season and treatment group.
a,b Taxa with a minimum abundance of 0.2% and FDR-corrected P value < 0.5 identified through the statistical MaAsLin2 R package in (a) the combined time point dataset and (b) the day 1 dataset. Taxa associated with treatment and season are highlighted in purple and green, respectively. Coefficient values shown on the x axis are taken from Supplementary Table 2. Values in parentheses next to the taxa name represent the relative abundance of the species.

