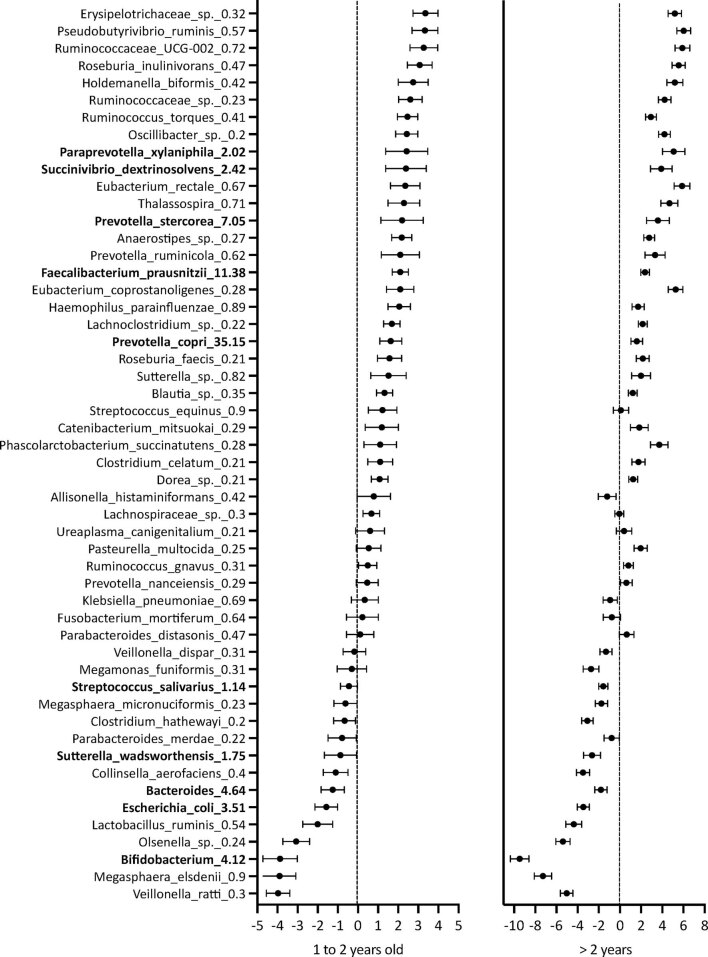
Extended Data Fig. 6. Mixed-effect linear regression to show bacterial changes across the three different age groups.
Mixed-effect linear regression was conducted to examining the effect of the three different age groups. The mean changes (95% CI) in TSS + CSSlog2 transformed + normalized data of one to two years old samples and >2-year-old samples compared to seven months to 12 months samples are shown. The analysis was adjusted for season, site (fixed effect) and child ID (multiple sampling = random effect). The taxa are sorted from largest negative mean change to largest positive mean change on the x axis. The top ten taxa with a minimum abundance of 1% high highlighted in bold. Mixed-effects linear regression analysis was restricted to the top 50 taxa with a minimum abundance of 0.2%. Importantly, no adjustments for multiple comparisons were made to the 95% confidence intervals. Subject identifier (child ID) was included as a random-effect to account for repeated measures. In this analysis, all 1389 samples across the three sampling timepoints were combined. The black points shows the estimated change and the error bars show the 95% confidence interval.

