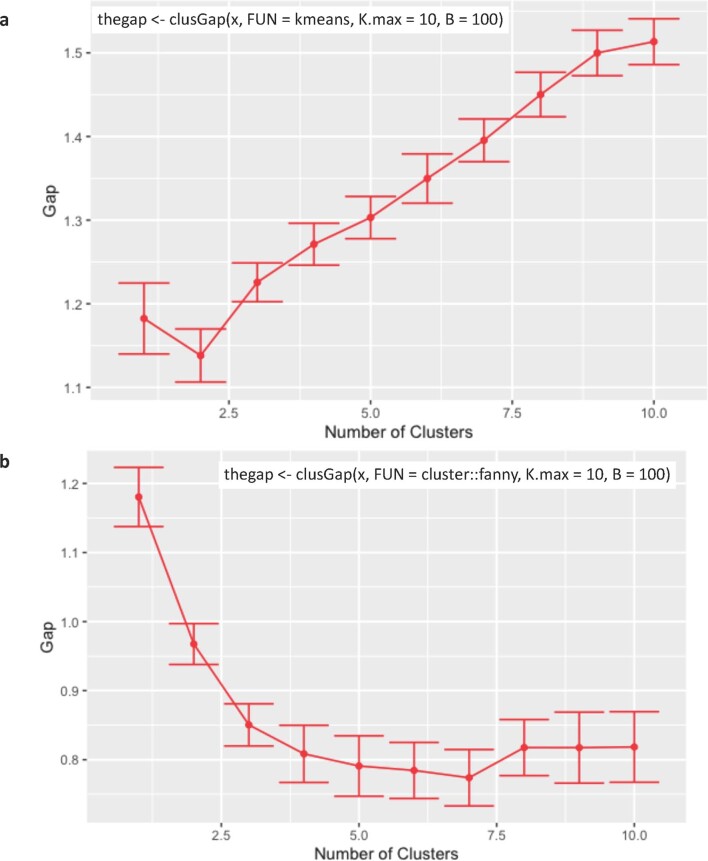
Extended Data Fig. 7. Using Gap Statistic to identify the best number of clusters for bacterial trophic network analysis.
Gap statistic using the R function “clusGap” from the R package “cluster” version 2.1.2 was used to calculate a goodness of clustering measure, the “gap” statistic. The “k.max” parameter was set to 10, the bootstrap “B” parameter was set to 100, and the analysis was done with two different “FUNcluster” method including cluster:fanny and kmeans. The analysis was restricted to the top 50 TSS transformed taxa with a minimum abundance of 0.2%. a. The analysis using the “FUNcluster” method “kmeans”. b. the analysis using the “cluster::fanny”. The numbers of statistical identified clusters are characterized by a decrease in Gap value on the Y axis. Once there is not further decrease in the Gap value (line started to flattened out) on the y axis, indicates the optimal number of clusters. For this analysis all 1389 samples across the three sampling timepoints were combined. The error bars indicate one standard error.

