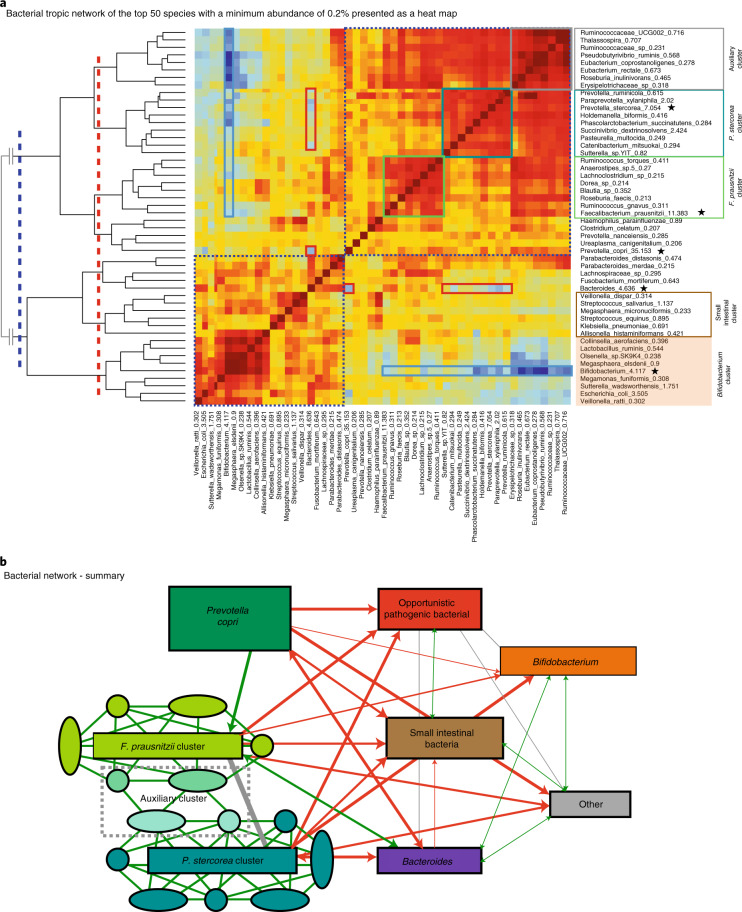
Fig. 5. Taxa association and trophic networks with all three time points combined.
a, A network heatmap was generated using the top 50 taxa with a minimum abundance of 0.2% in all samples. The most dominant clusters identified in the bacterial trophic network correlation analysis are highlighted by different coloured boxes and were confirmed by gap statistics. Two different settings in the gap statistical analysis identified two (blue dotted line) and seven clusters (red dotted line), respectively. The P. stercorea network is highlighted in teal, the F. prausnitzii network in light green, the Bifidobacterium network in yellow, an auxiliary group in grey and a small intestinal microbiome network in brown. The red heatmap colour indicates a strong positive correlation and the blue heatmap colour indicates a strong negative correlation. Red boxes denote a negative association between Prevotella species and Bacteroides and blue boxes denote a negative association between Bifidobacterium and other taxa. The main representative taxa for each cluster are marked by a star. b, Bacterial network summary. Spearman’s rho correlation coefficient analysis was used to identify a bacterial trophic network with the strongest self-correlations. The leading taxa in each network is highlighted. A positive correlation is highlighted by green lines, a negative correlation by red lines and an intermediate correlation by grey lines.

