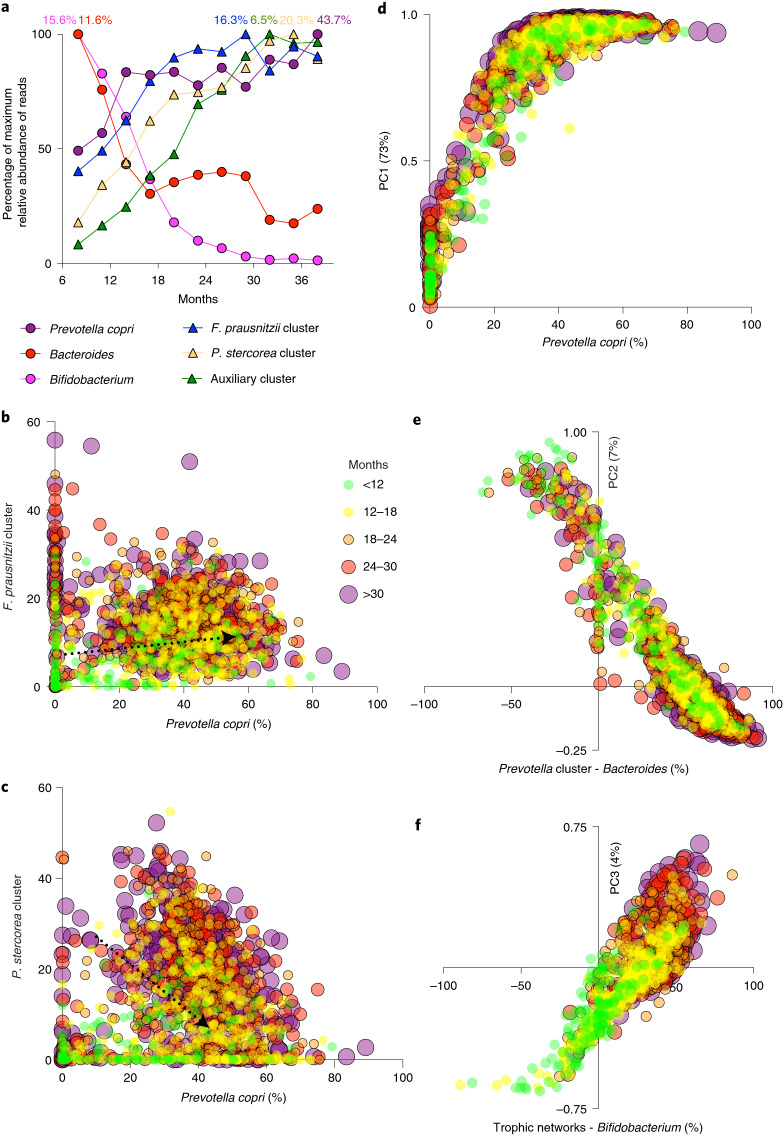
Fig. 6. Maturation process analysed by correlation and principal component analysis.
a, Abundances over time of the most relevant bacterial clusters depicted in Figs. 3 and 5 as important separate species/genera. Each bacterial group is normalized by its highest abundance at any time point. The highest abundance of each group (100% on the y axis) is depicted at the top as a percentage. Bifidobacterium and Bacteroides decrease over time, whereas the other groups increase over time but at different rates. b,c, Scatterplots of P. copri and the F. prausnitzii cluster (b) or the P. stercorea cluster (c). Because of the extremely high abundance of P. copri a numerically induced (weak) negative association is to be expected even between other clusters where no antagonistic interaction occurs, like with the P. stercorea cluster. The F. prausnitzii cluster, however, has a weak positive correlation with P. copri. d–f, Bacterial clusters and main species represent the main principal components within this dataset. d, PC1 is nearly fully described by the abundance of P. copri, the most abundant species at every point in time in this study. e, PC2 represents the antagonistic interaction between the Prevotella genus and the Bacteroides genus, where Prevotella is represented by the combined abundance of P. copri and the P. stercorea cluster. f, PC3 represents a shift away from a gut dominated by Bifidobacterium, as seen in young infants, towards the development of complex trophic networks as represented here by the combined abundance of the F. prausnitzii cluster, the P. stercorea cluster and the auxiliary cluster. PC3 is most strongly correlated with age. Percentages indicate the per cent variation explained by each principal component in the combined dataset.

