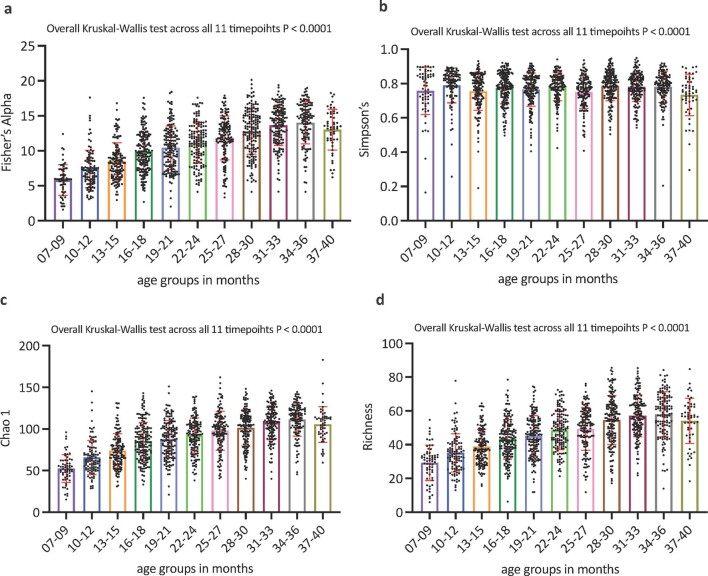
Extended Data Fig. 2. Alpha diversity indexes differs between the 11 3-month age groups interval datasets in the combined sampling timepoints data.
The Fisher’s alpha diversity index (a), the Simpson’s diversity index (b), the Chao1 estimated richness (c), and the observed richness (d) did differ significantly across the 11 3-month age groups as analysed by the non-parametric Kruskal-Wallis test. Data were tested for normality using the Anderson-Darling and the D’Agostino & Pearson test in Prism 9 for macOS and were non-normally distributed. Data were considered to be statistically significant with a confidence level of 95%. Data were plotted using the Scatter dot plot function in Prism 9 for macOS with a line drawn at the mean with error bars extending to the standard deviation. In this overall general presentation of the alpha diversity indexes, all 1389 samples across the three sampling timepoints were combined. The same analysis was performed for the three different individual sampling timepoints Day 1, Day 15, and Day 85 which is shown in Extended Data Fig. 3.

