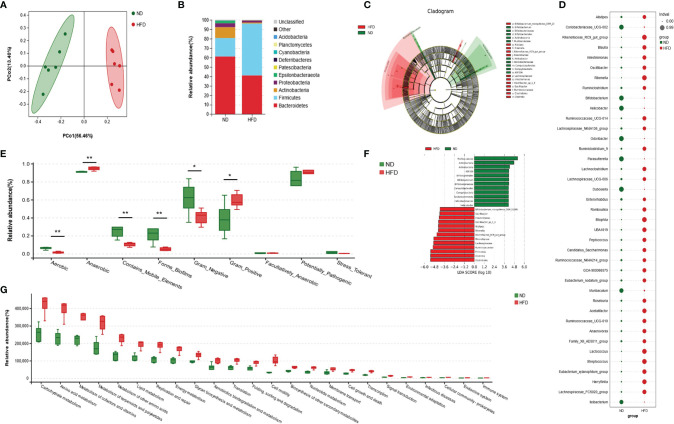
Figure 3.
High-fat diet altered the composition and function of gut microbiota. (A) Principal coordinate analysis (PCoA) of gut microbiota (GM) in ND-fed and HFD-fed mice (n = 6). (B) The relative abundance of GM at the phylum-level in both groups (n = 6). (C, F) Cladogram showing the most differentially abundant taxa identified by linear discriminant analysis effect size (LEfSe). Red indicates clades enriched in the HFD group, and green indicates clades enriched in the ND group. Genera meeting a linear discriminant analysis (LDA) score threshold > 4 are shown in Figure 3F (n = 6). (D) Indicator analysis through calculating indicator value (IndVal). The greater the IndVal, the more likely the genus is to become the indicator for the group (n = 6). (E) Bugbase prediction of GM phenotypes for both groups (n = 6), *P < 0.05, **P < 0.01. (F) Functional enrichment analysis of GM based Kyoto Encyclopedia of Genes and Genomes (KEGG) pathway. The KEGG pathways of level 2 (P<0.05) are listed (n = 6).

