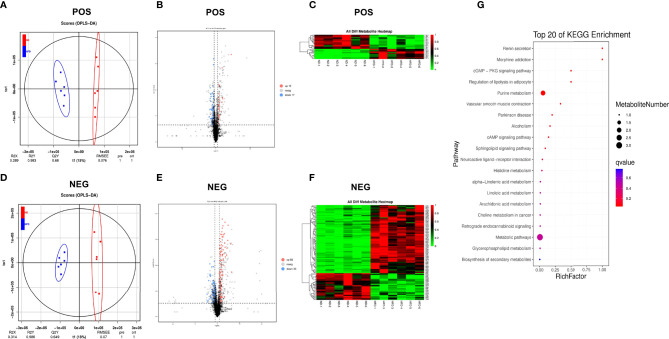
Figure 4.
High-fat diet changed the serum metabolome. (A, D) OPLS-DA scores plot of serum metabolite profiling between the ND and HFD groups in both the positive and negative modes. (B, E) Volcano plot analysis of serum metabolites (VIP > 1,|P(corr)| > 0.5, jackknifed 95% confidence intervals). (C, F) Heat maps of serum metabolites of the two groups based on the linear transformation of the raw data (the interval of [0,1]). (G) The bubble diagram of the top 20 KEGG enriched pathways.

