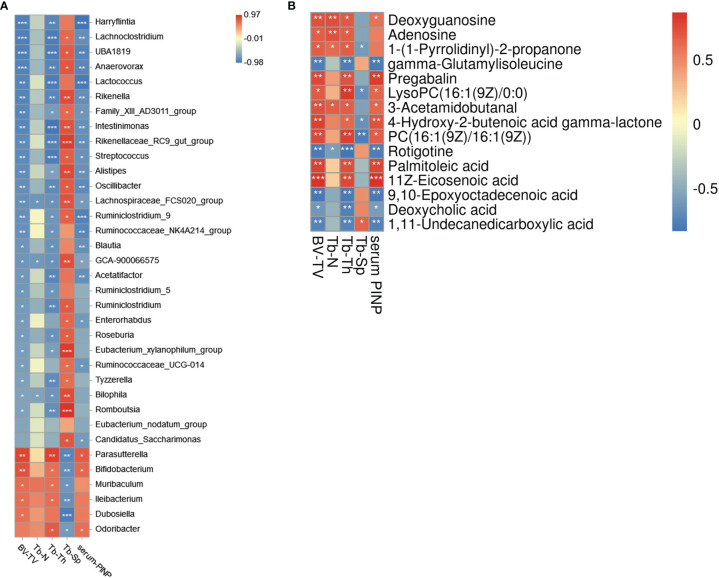
Figure 5.
Association analysis of gut microbiota, bone phenotypes, and serum metabolome. (A) The heat map of Spearman rank correlation coefficients between the GM and bone phenotypes (|r|>0.6). (B) The heat map of Spearman rank correlation coefficients between the serum metabolites and bone phenotypes. *P < 0.05, **P < 0.01, ***P < 0.001.

