FIGURE 2.

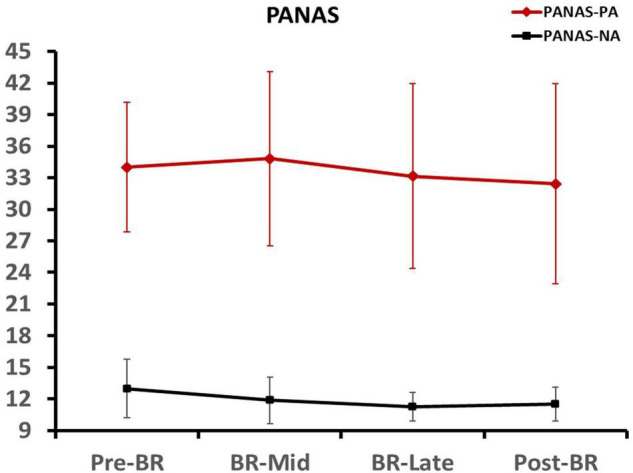
Participants’ positive affect and negative affect scores at different time points. Error bars indicate standard deviation of the mean.

Participants’ positive affect and negative affect scores at different time points. Error bars indicate standard deviation of the mean.