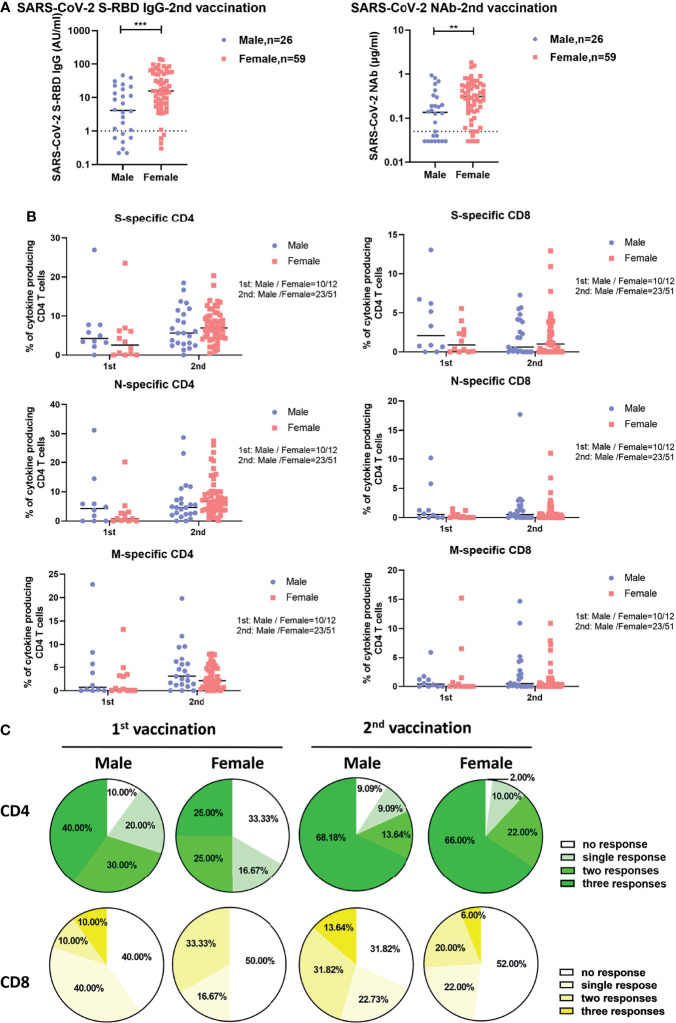
Figure 2.
Differences in SARS-CoV-2-specific humoral and cellular immune responses between male and female vaccinees. (A) Comparison of the SARS-CoV-2 S-RBD IgG and NAb levels in serum after the second vaccination between male and female vaccinees. The dotted line indicates the cut-off value of the antibody. (B) Comparison of the magnitude of CD4+ and CD8+ T cell responses against S, N, and M of SARS-CoV-2 between male and female vaccinees. (C) Comparison of the breadth of CD4+ and CD8+ T cell responses between male and female vaccinees. Each symbol represents an individual donor with a line indicating the median of each group. Mann Whitney U test was used to test the statistical significance of data shown in (A, B). **P < 0.01; ***P < 0.001.

