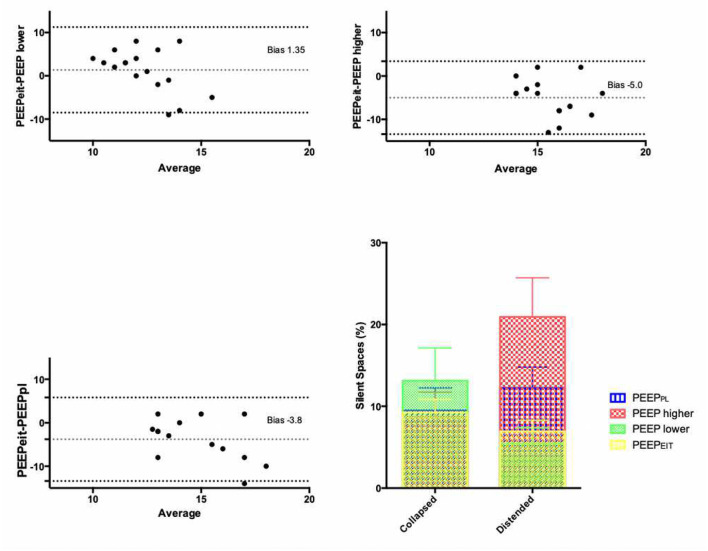
Figure 1.
Bland-Altman plots evaluating agreement between PEEP derived from EIT (PEEPEIT) and positive end-expiratory pressure (PEEP) values derived from lower and higher PEEP/FiO2 tables and PL/FiO2 table. Dotted lines: bias and its 95% confidence interval. Lower right panel: percentages of collapsed and distended lung regions measured by electrical impedance tomography (EIT) under different PEEP settings. Percentage of collapse was lower with PEEPEIT than with lower PEEP/FiO2 table (p = 0.04), while percentage of distended areas was reduced as compared to higher PEEP/FiO2 and PL/FiO2 tables (p < 0.01).

