
Figure 1.
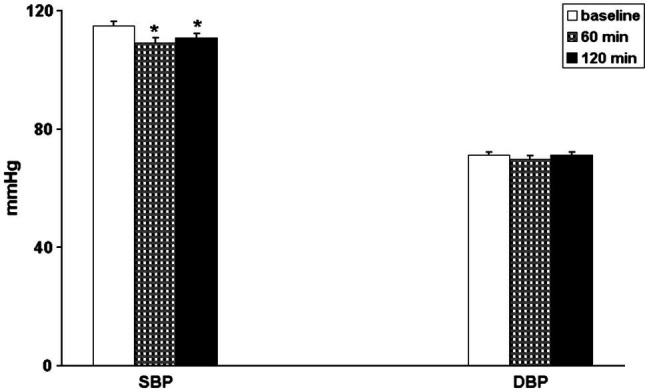
Bar graphs showing systolic (SBP) and diastolic (DBP) blood pressure in 42 coronary artery patients in baseline conditions (open bars) and 60 min (hatched bars) and 120 min (black bars) after exercise. *p < 0.05 vs. baseline.
Official websites use .gov
A
.gov website belongs to an official
government organization in the United States.
Secure .gov websites use HTTPS
A lock (
) or https:// means you've safely
connected to the .gov website. Share sensitive
information only on official, secure websites.
Bar graphs showing systolic (SBP) and diastolic (DBP) blood pressure in 42 coronary artery patients in baseline conditions (open bars) and 60 min (hatched bars) and 120 min (black bars) after exercise. *p < 0.05 vs. baseline.