
Figure 3.
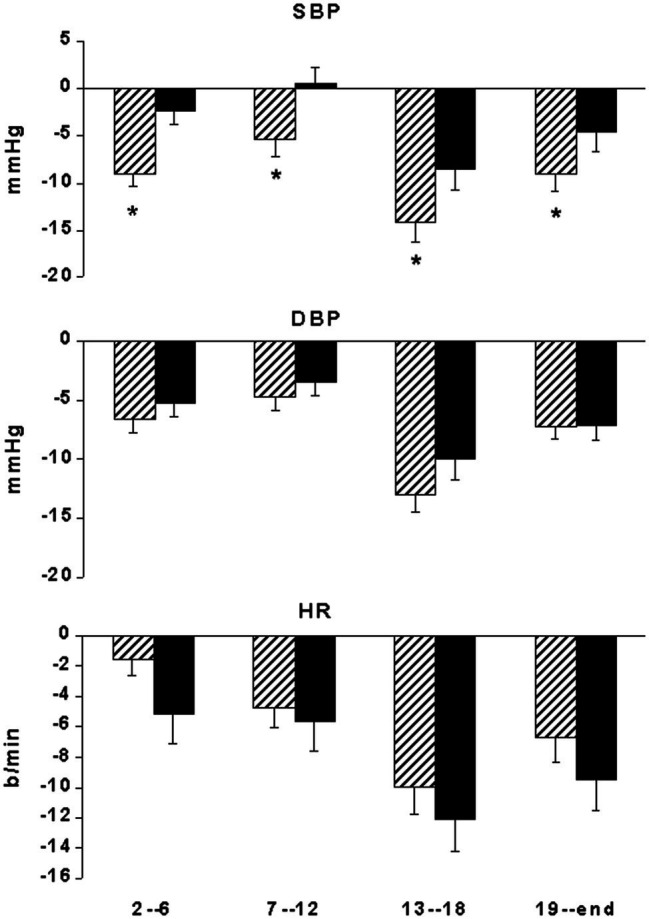
Bar graphs showing systolic (SBP) and diastolic (DBP) blood pressure and heart rate (HR) changes from the start of ABPM in 29 coronary artery patients at 2nd–06th, 7–12th, 13–18th, and 19–24th interval hours after exercise training session (hatched bars) compared with measurements taken at the same time of day on a nonexercise control day (black bars). *p < 0.05 vs. nonexercise control day.