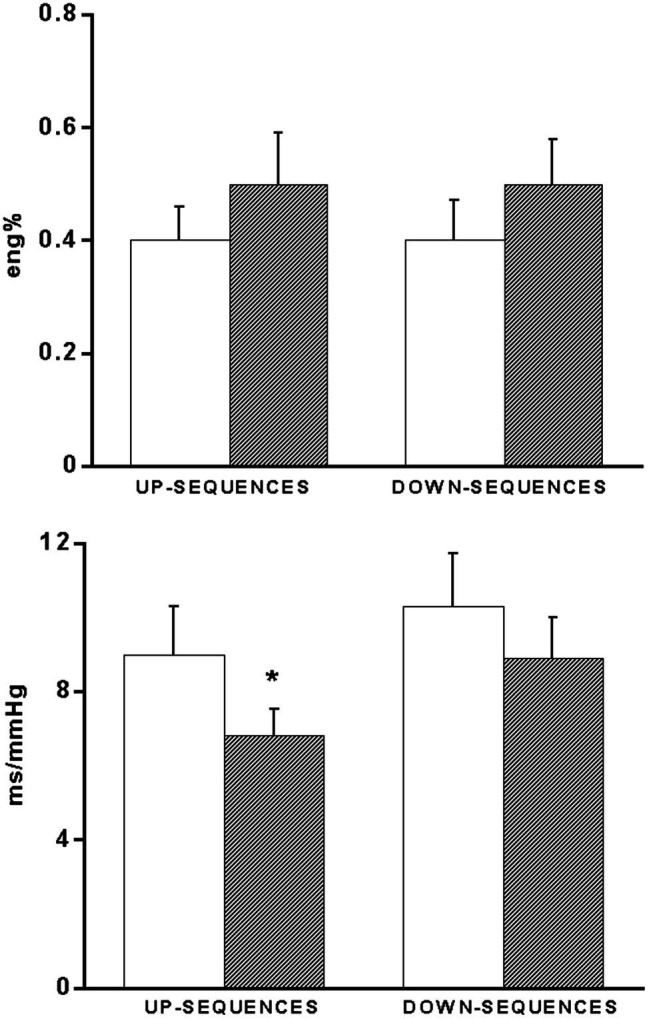
Figure 4.

Bar graphs showing the occurrence (eng%, see methods) of up- and down-baroreflex sequences (upper panel) and baroreflex sensitivity values calculated separately for up- and down-baroreflex sequences (bottom panel) in 15 coronary artery patients baseline conditions (open bars) and 60 min after exercise (hatched bars). *p < 0.05 vs. baseline.
