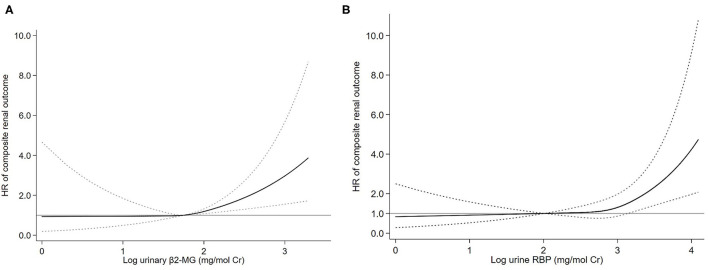
Figure 2.
Association of log-transformed urinary β2-microglobulin (β2-MG) (A) and log-transformed urinary retinol-binding protein (RBP) (B) levels with the composite renal outcome. Three knots at the 25th, 50th, and 75th percentiles were used to model restricted cubic splines. Solid lines are multivariable adjusted hazard ratios, with dashed lines showing 95% CIs for the spline model (reference: log β2-MG 1.75 mg/mol Cr and log RBP 2.00 mg/mol Cr). Models were adjusted for age, sex, mean arterial pressure (MAP), log-transformed proteinuria, serum creatinine, and the Oxford classification (MEST-C scores).

