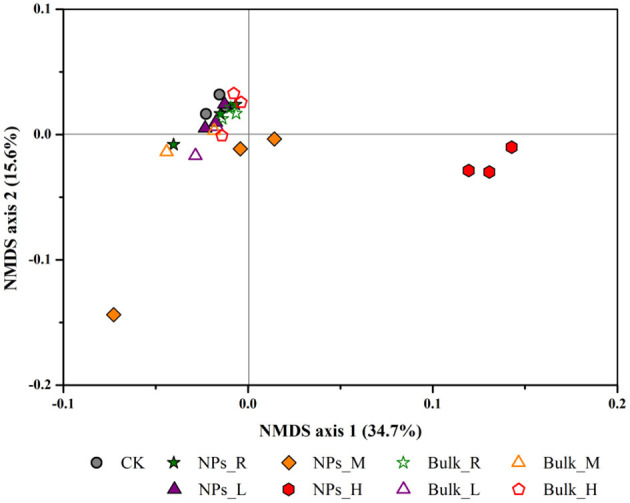
Figure 5.

Bacterial community compositional structure as indicated by a non-metric multi-dimensional scaling plot of the weighted pairwise UniFrac community distances under different concentrations of AgNPs in a paddy soil. R, L, M, and H represent 0.1, 1, 10, and 50 mg/kg, respectively. CK indicates the treatments without Ag particle amendment.
