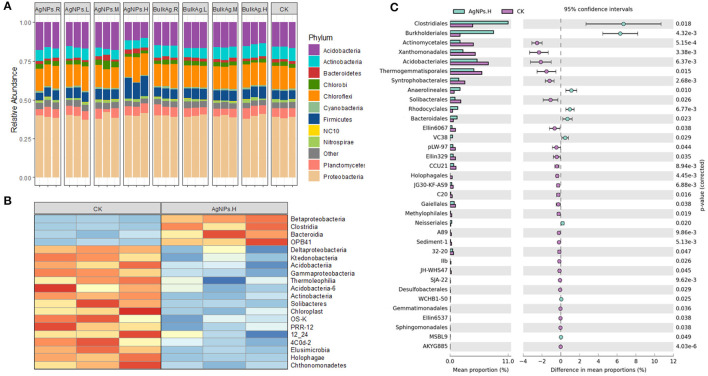
Figure 6.
The bacterial community variation characteristic under different concentrations of AgNPs in a paddy soil. (A) The relative abundance of soil bacteria at the phylum level. (B) The heat map of soil bacteria at the class level. (C) The response ratio of soil bacteria at the order level. R, L, M, and H represent 0.1, 1, 10, and 50 mg/kg, respectively. CK indicates the treatments without Ag particle amendment.

