
Figure 5.
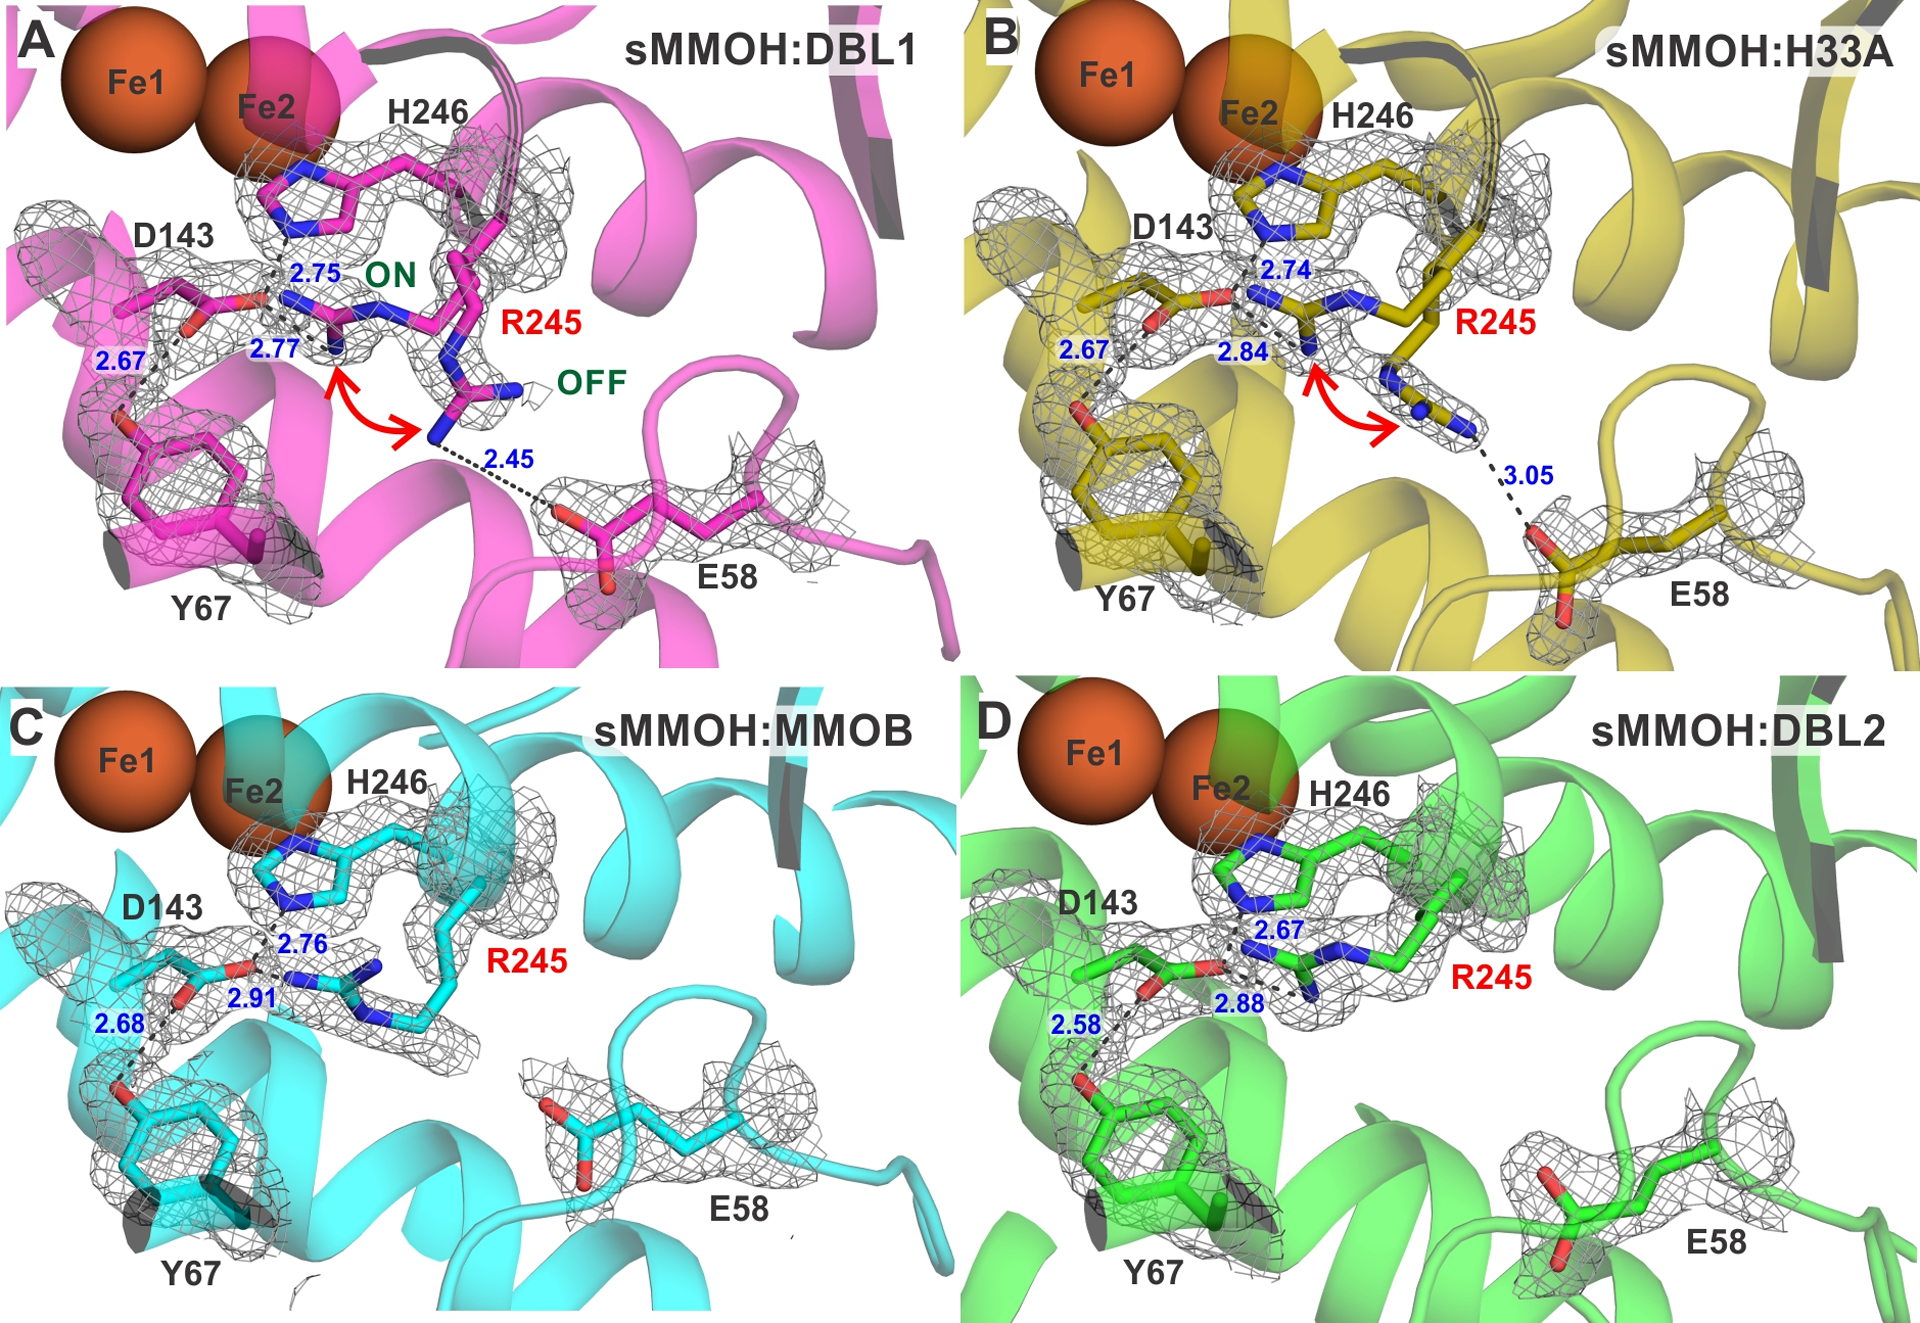
The proximal hydrogen bond network to the H246 ligand of Fe2. The sMMOH:MMOB-variant complex is indicated on the figure (A-D).The 2mFo-DFc electron density map shown as a gray mesh is contoured at 1.1 σ. Salt bridges and hydrogen bonds are represented by black dashed lines. Bonding distances are labeled in blue (Å). An analogous hydrogen bond network is present on the histidine ligand to Fe1 and is not displayed here. The loop backbone of L244 and R245 is colored in gray in panels A and B. The ON and OFF positions for R245 are labeled in panel A.