
Figure 7.
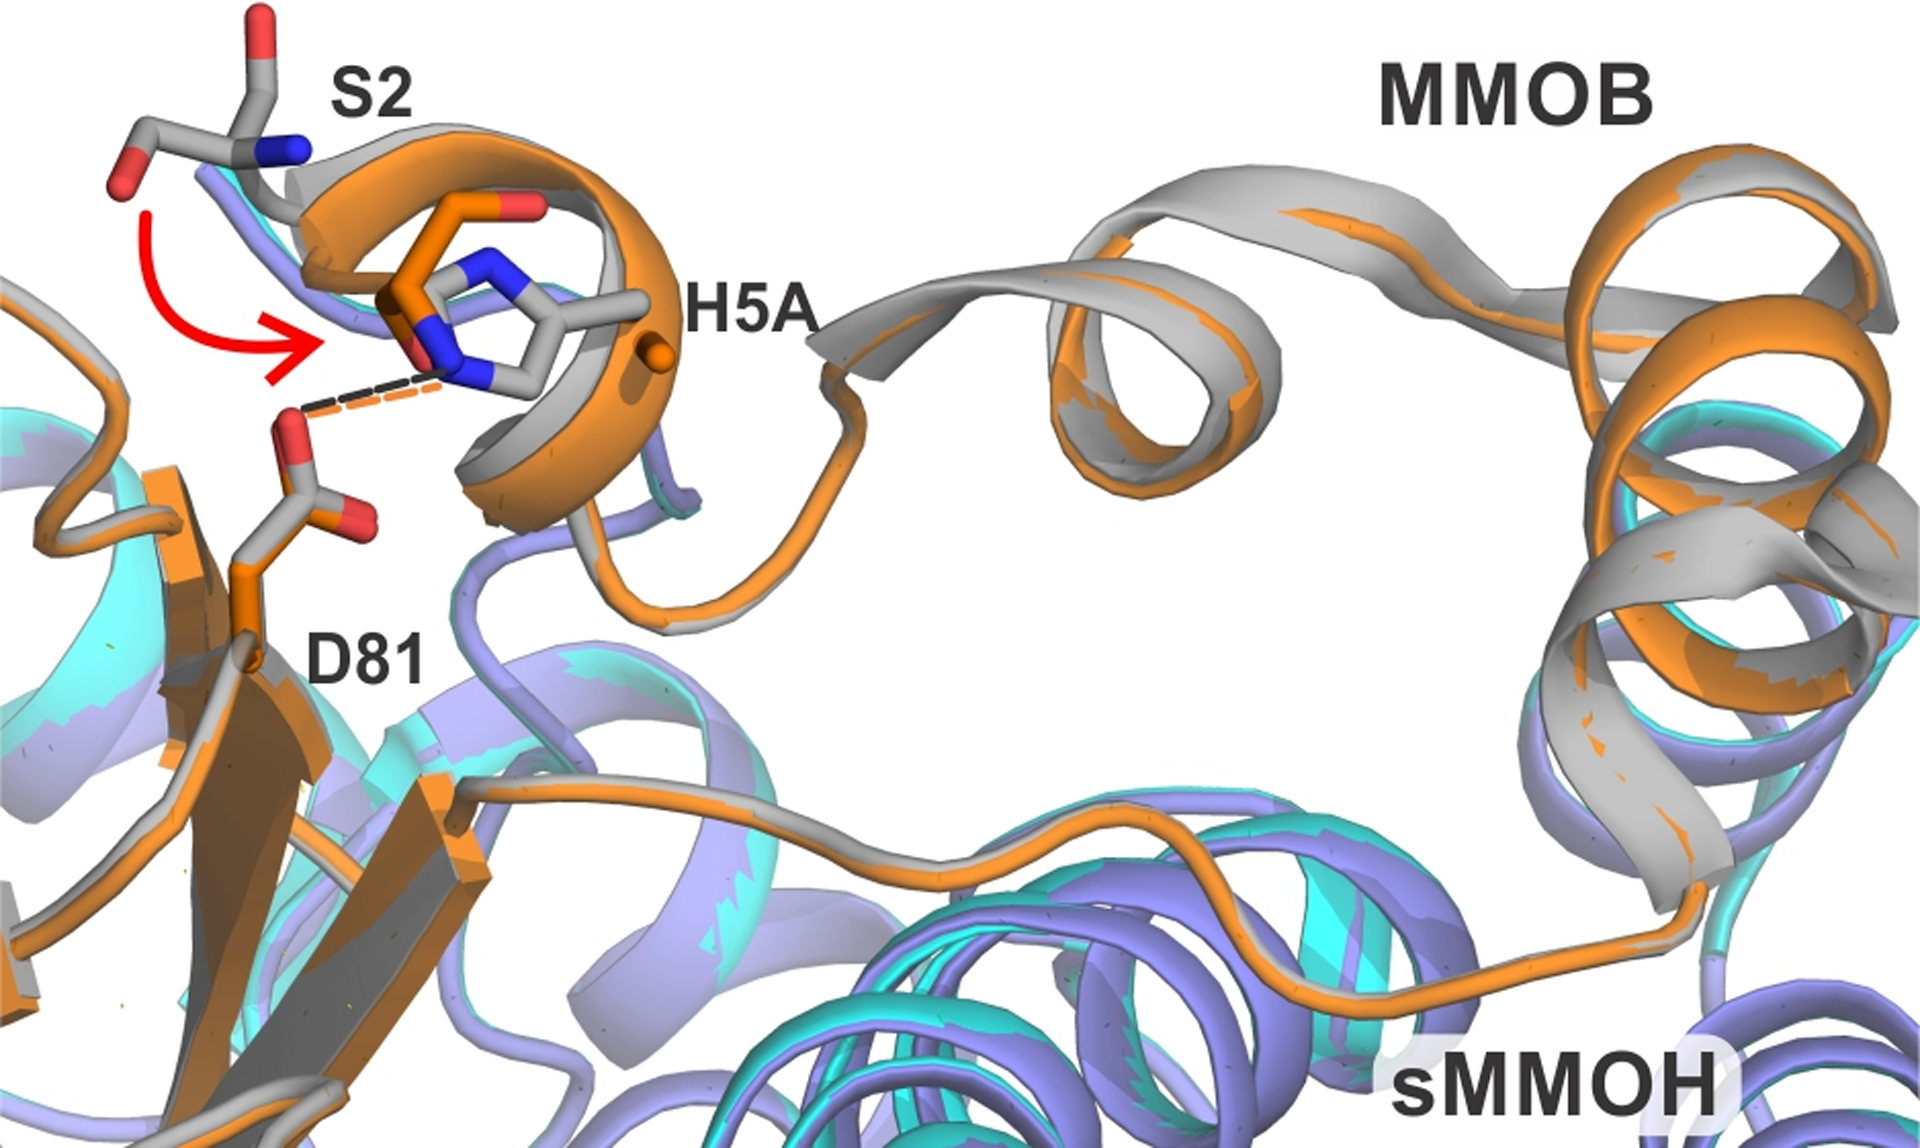
Close up view of the site of H5A mutation in the protein complex compared with the wild type protein. The hydrogen bonds in the sMMOH:MMOB complex are shown as orange dashed lines while they are shown as black dashed lines in the sMMOH:H5A complex. Color legend: sMMOH:MMOB complex: sMMOH = cyan, MMOB = gray; sMMOH:H5A complex: sMMOH = purple-blue, H33A MMOB = orange.