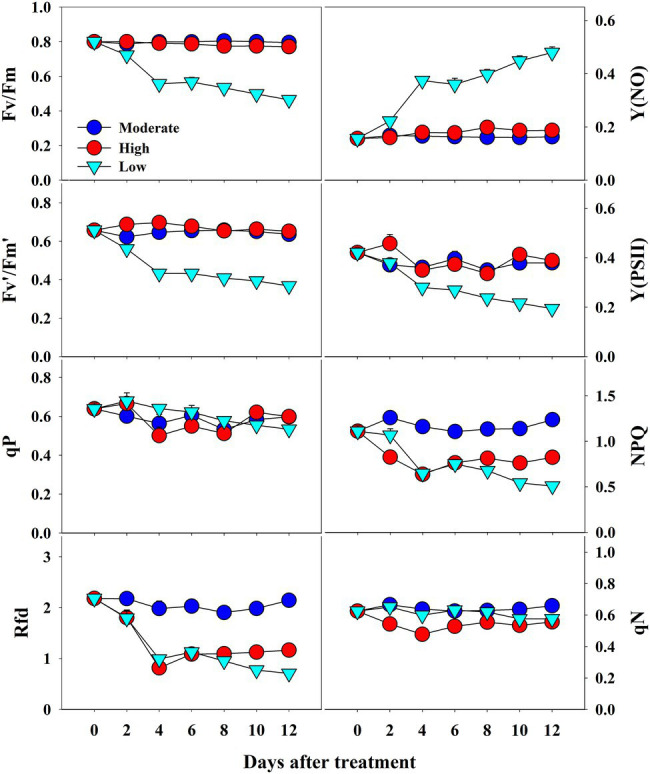
Figure 7.

Changes in CF parameters in grafted watermelon seedlings grown under moderate, high and low temperature during progressive treatment time. Each plot point represents the mean ± SD of seven biological replicates. Refer Table 1 for the description of each parameter.
