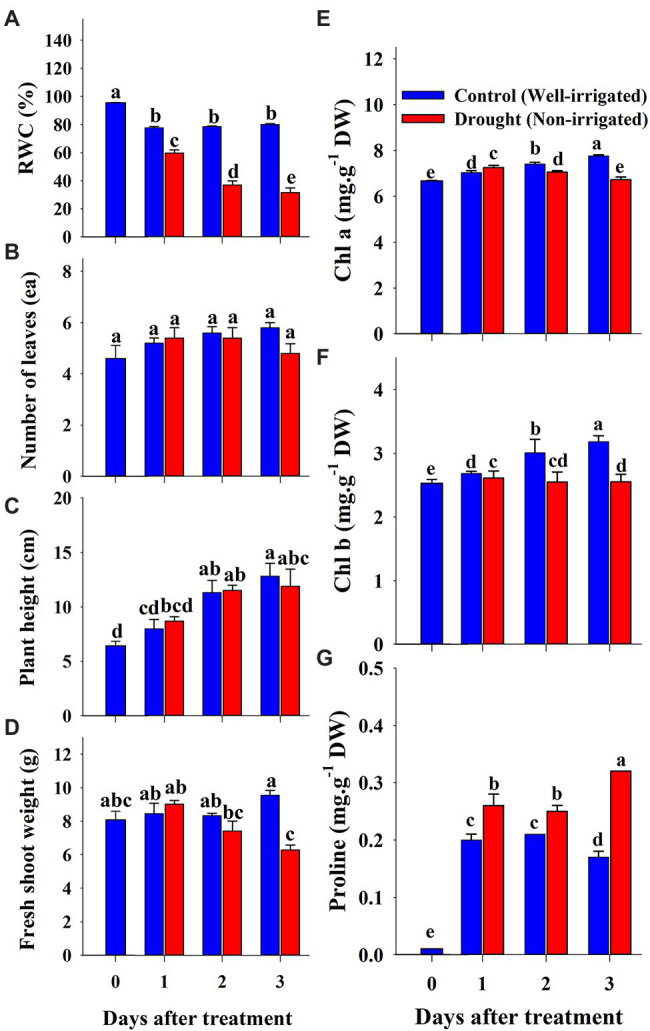
Figure 8.

Changes in growth parameters (A–D), chlorophyll (E,F) and proline (G) content of grafted watermelon seedlings grown under drought stress during the progressive treatment time. Each bar represents the mean ± SD of five biological replicates in growth parameters, and three replicates in chlorophyll and proline content. Different letters within a figure indicate a significant difference at p < 0.05 by Duncan’s multiple range test. RWC: relative water content.
