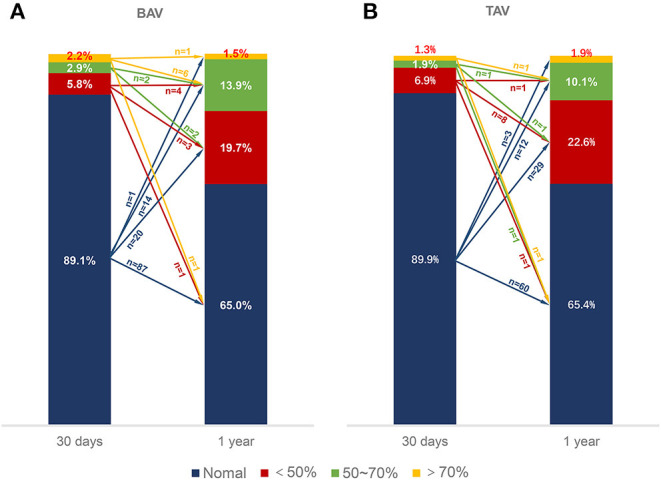
Figure 3.

Evolution of RELM. The different color bars represented normal leaflets, <50% RELM, ≥50%, <70% RELM and ≥70% RELM respectively. The different color arrows represented evolution of RELM form 30 days to 1-year follow-up. The numbers upon the color arrows represented the number of patients. BAV, bicuspid aortic valve; RELM, reduced leaflet motion; TAV, tricuspid aortic valve.
