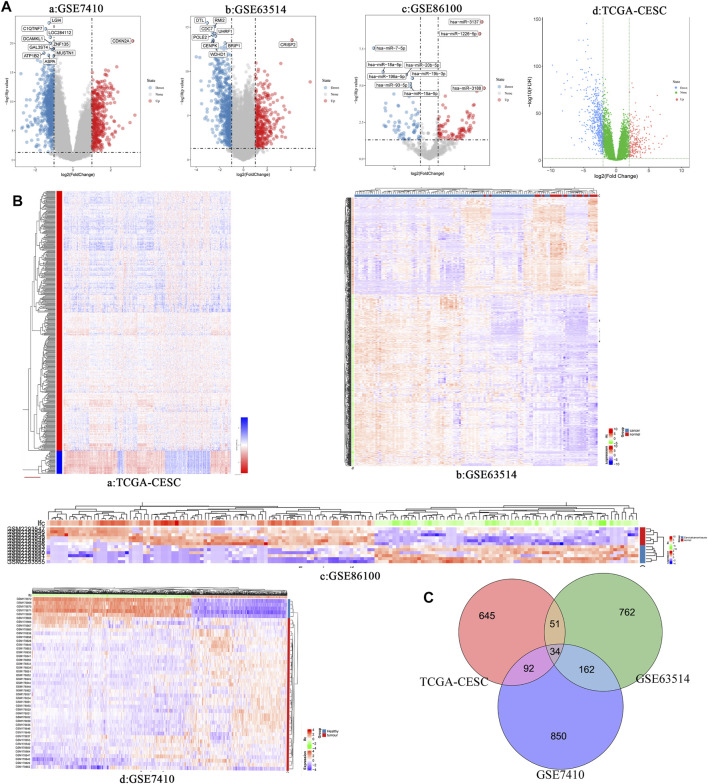
FIGURE 1.
(A) Volcano plots of differentially expressed RNAs (mRNA and miRNA) in different data set of cervical cancer. a: GSE7410; b: GSE63514; c: GSE86100; d: TCGA-CESC. (B) Heatmap of differentially expressed RNAs (miRNA and mRNA) in different data set of cervical cancer. a: TCGA-CESC; b: GSE63514; c: GSE86100; d: GSE7410. (C) Venn diagram show the intersection results of differentially expressed genes in three different data sets of cervical cancer.

