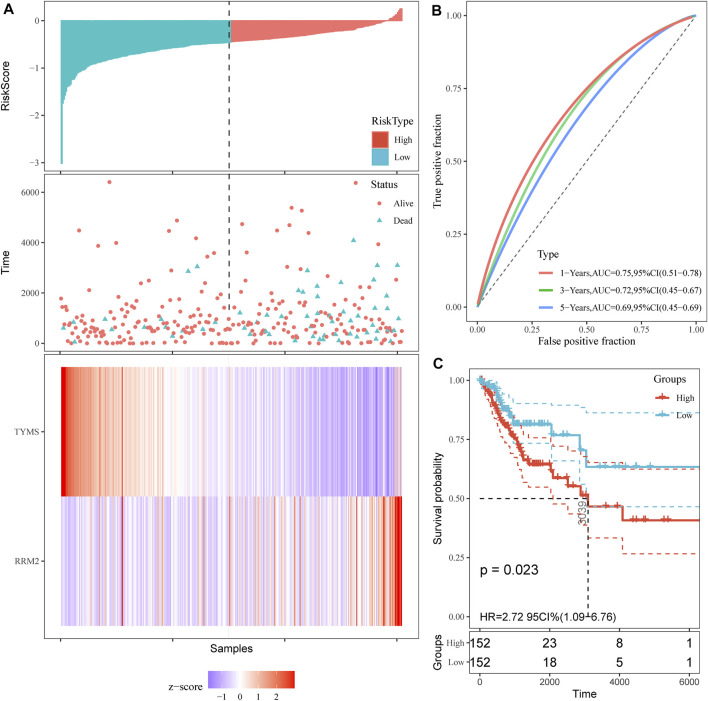
FIGURE 3.
Prognostic risk score model analysis of TYMS and RRM2 in cervical cancer. (A) Risk score and cervical cancer patient of survival status distribution, and heatmap of TYMS and RRM2 expression by risk score. (B) ROC curves for predicting survival in cervical cancer patients by the risk score. (C) Kaplan–Meier curves for high and low-risk groups of cervical cancer patient by risk score.

