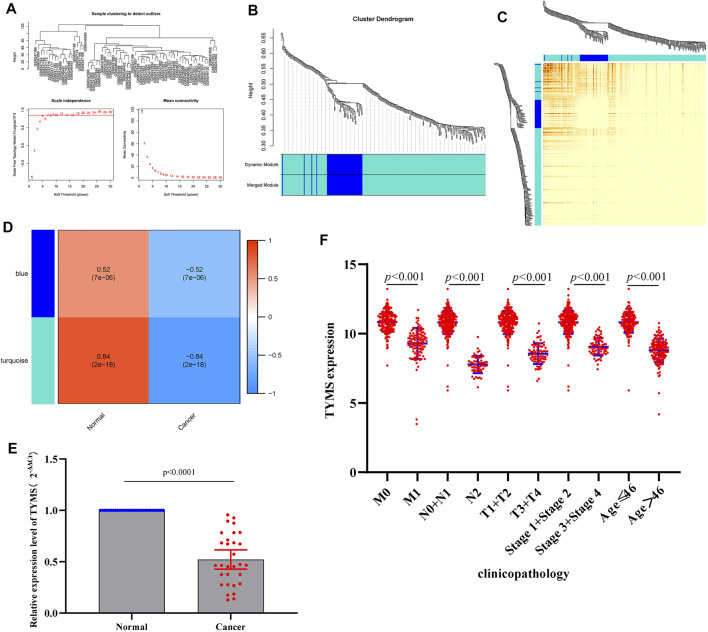
FIGURE 4.
(A) a scale-free network of samples in GSE9750 data. (B) Module Dendrogram of genes in GSE9750 data. (C) Heatmap of the topological overlap map. (D) Module−trait relationships (normal sample vs cervical cancer sample). (E) RT-qPCR results of the expression levels of TYMS in 30 paired cervical cancer tissues and their corresponding adjacent normal tissues. The data were shown as mean ± standard deviations. (F) Correlation analysis of the expression of TYMS with clinicopathological parameters.

